-
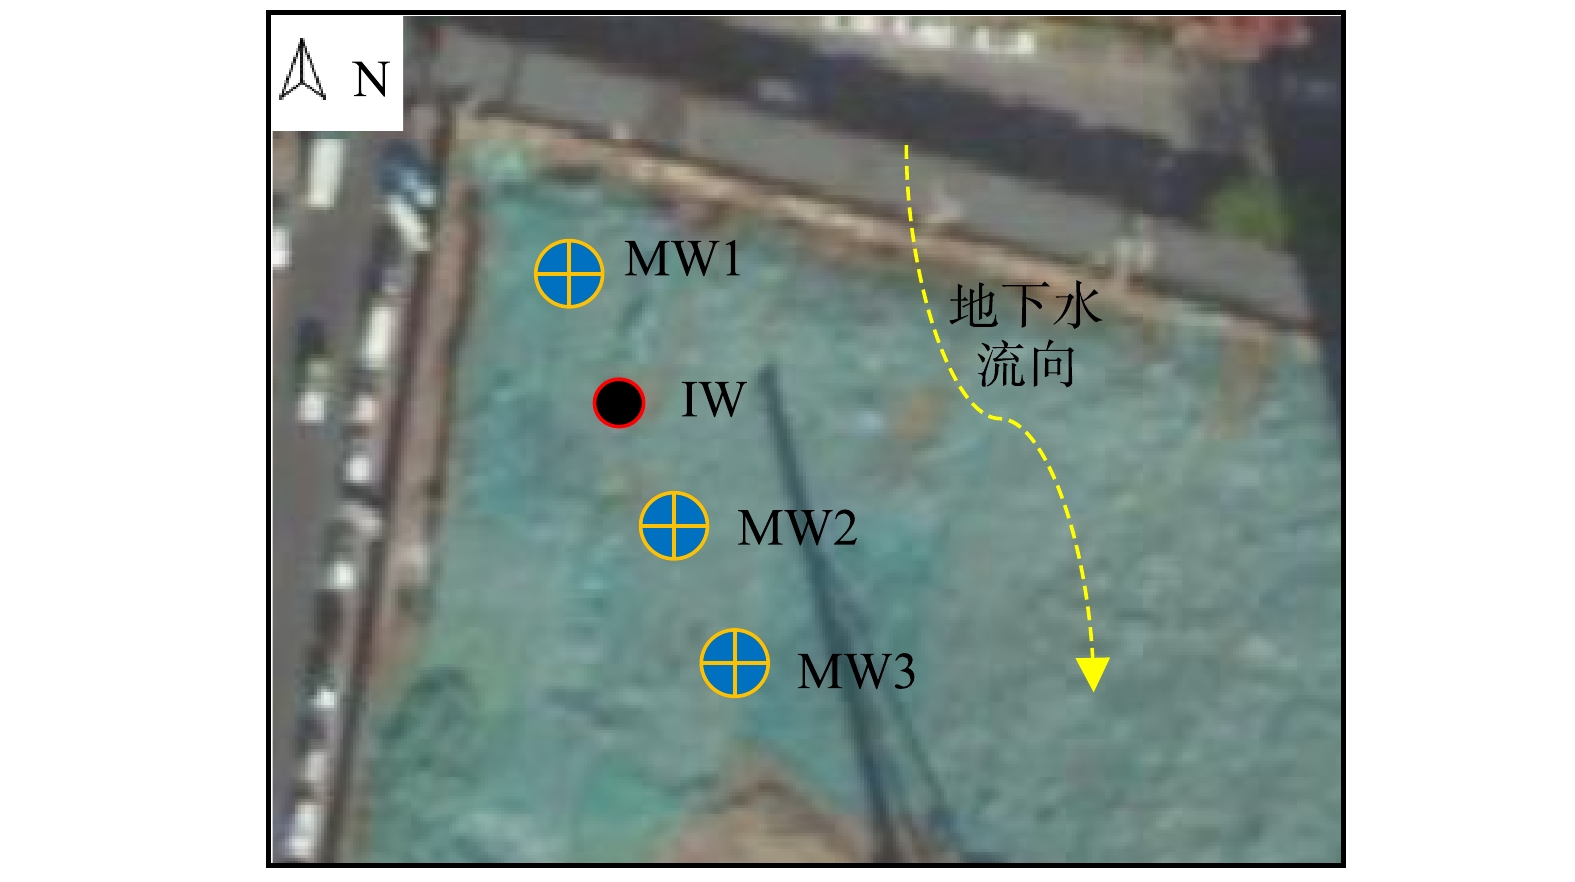
图 1 中试区注入井(IW) 及监测井(MW) 分布示意图
Figure 1. Distribution diagram of injection well (IW) and monitoring wells (MW) in pilot area
-
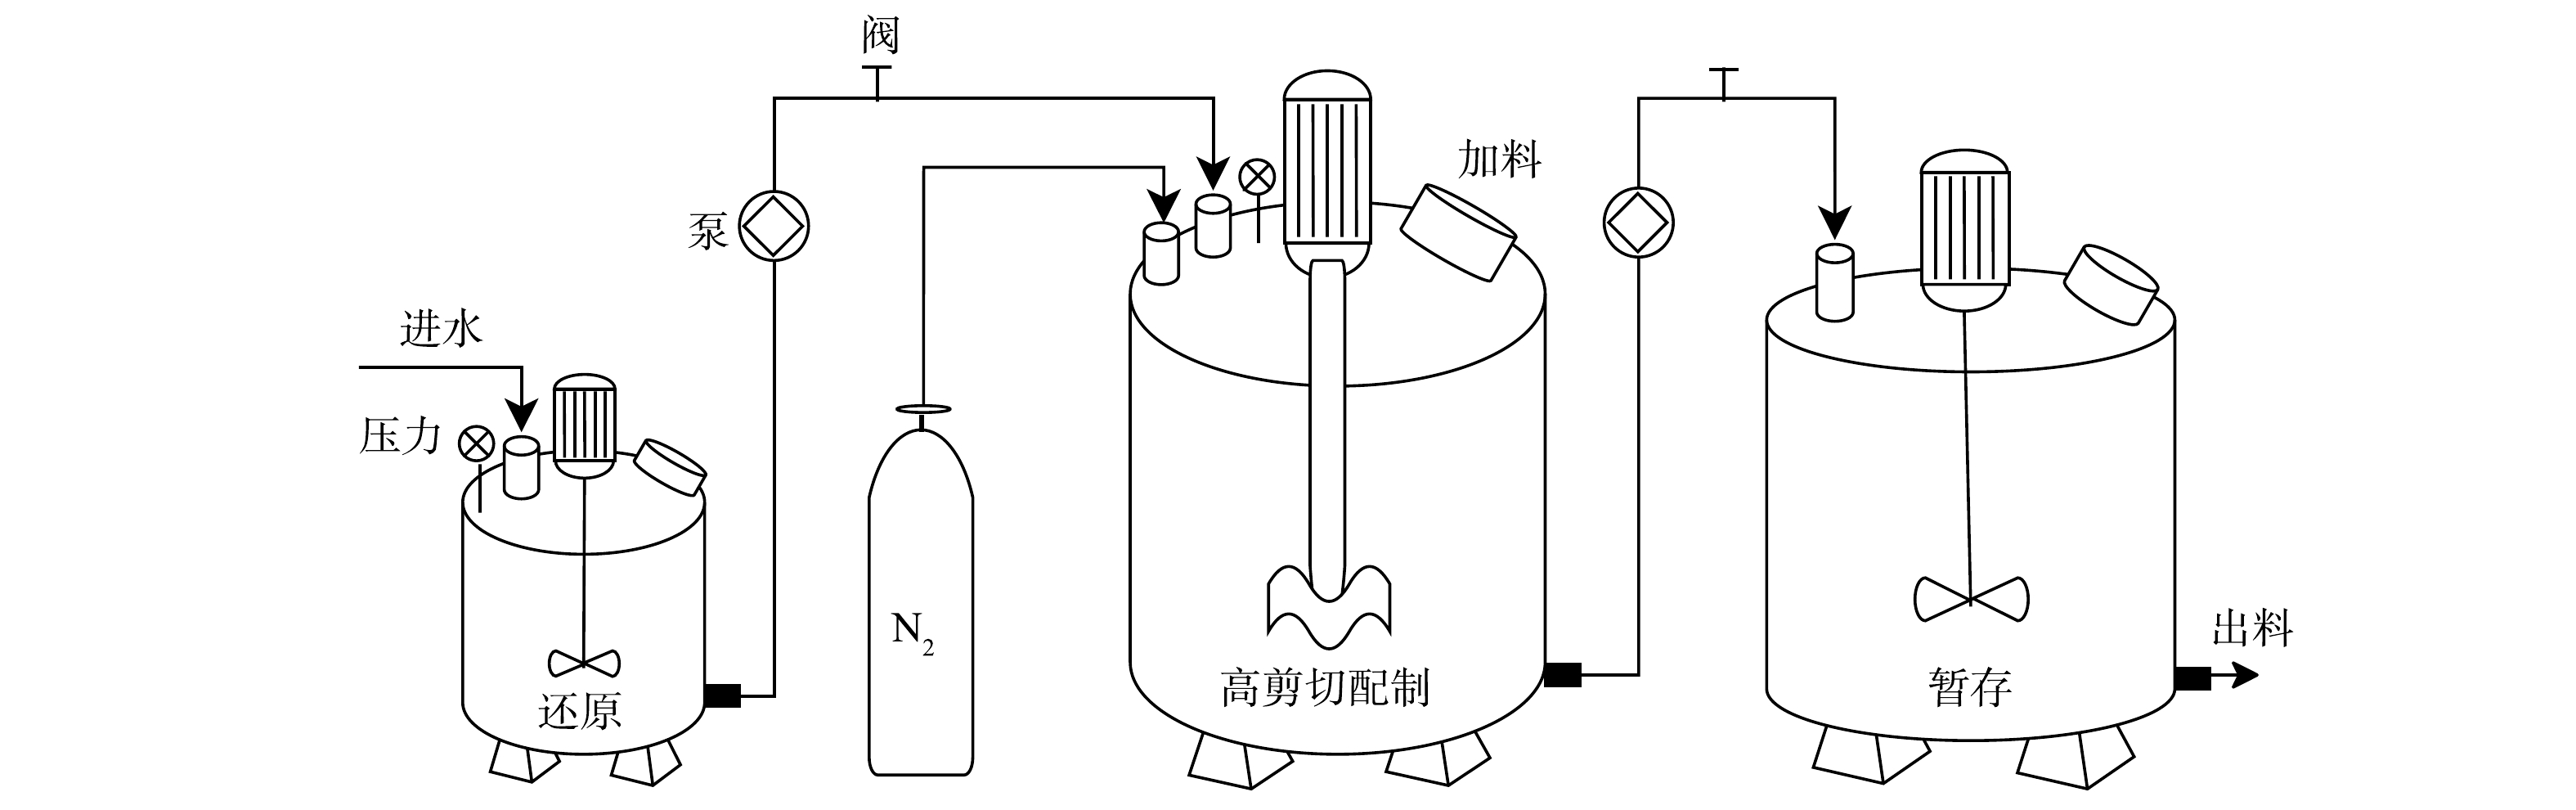
图 2 nZVI现场制备设备及过程示意图
Figure 2. Schematic diagram of on-site preparation equipment and process of nZVI
-
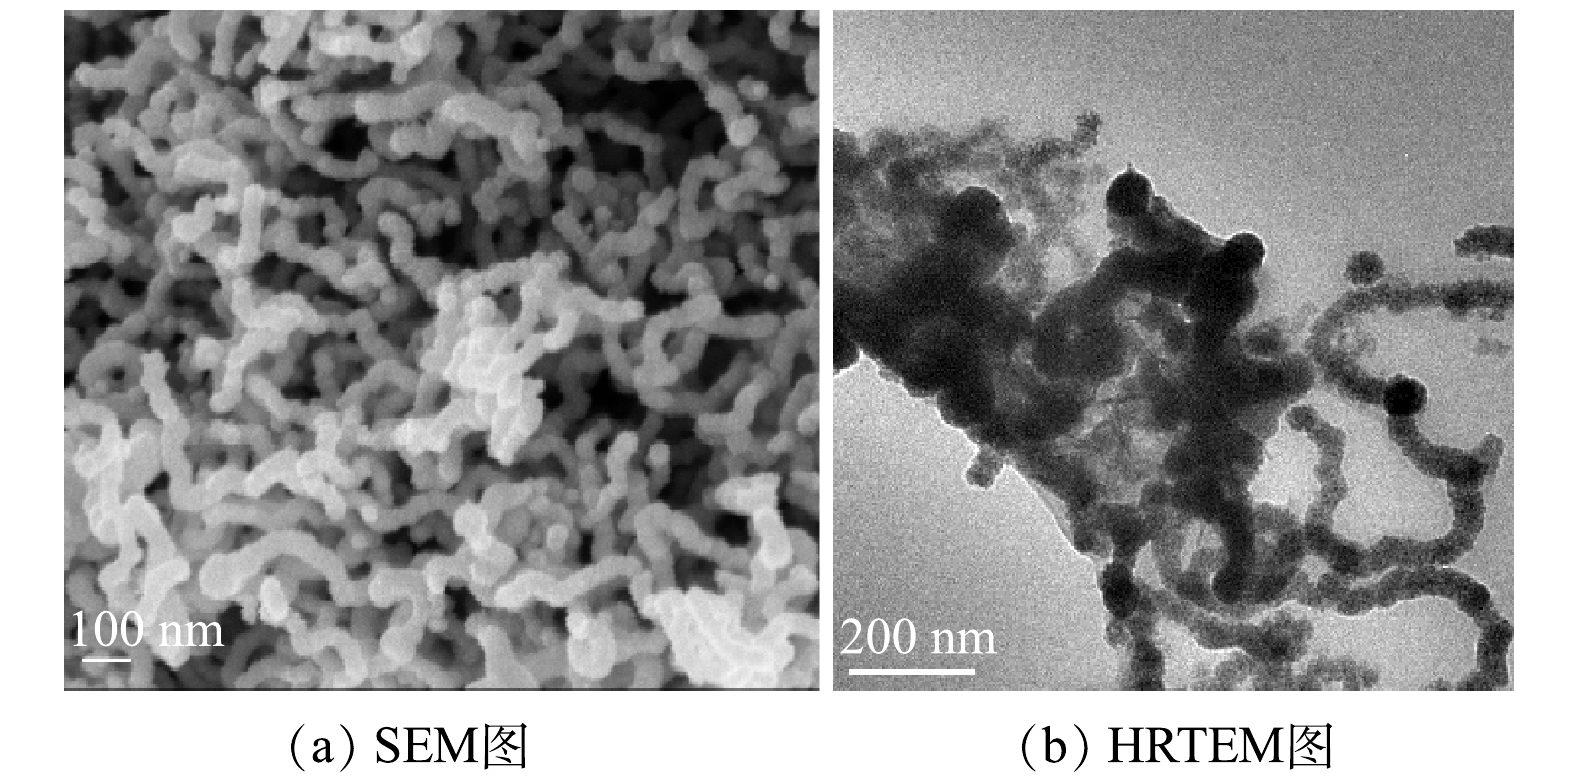
图 3 CMC-nZVI的微观形貌 (制备体积: 500 L)
Figure 3. Micro-morphology of CMC-nZVI (volume of liquid nZVI: 500 L)
-

图 4 监测井MW1中各氯代烃的浓度变化趋势
Figure 4. Variation of chlorinated hydrocarbons in MW1 monitoring well
-

图 5 监测井MW2中各氯代烃的浓度变化趋势
Figure 5. Variation of chlorinated hydrocarbons in MW2 monitoring well
-
图 6 监测井MW3中各氯代烃的浓度变化趋势
Figure 6. Variations of chlorinated hydrocarbons in MW3 monitoring well
-
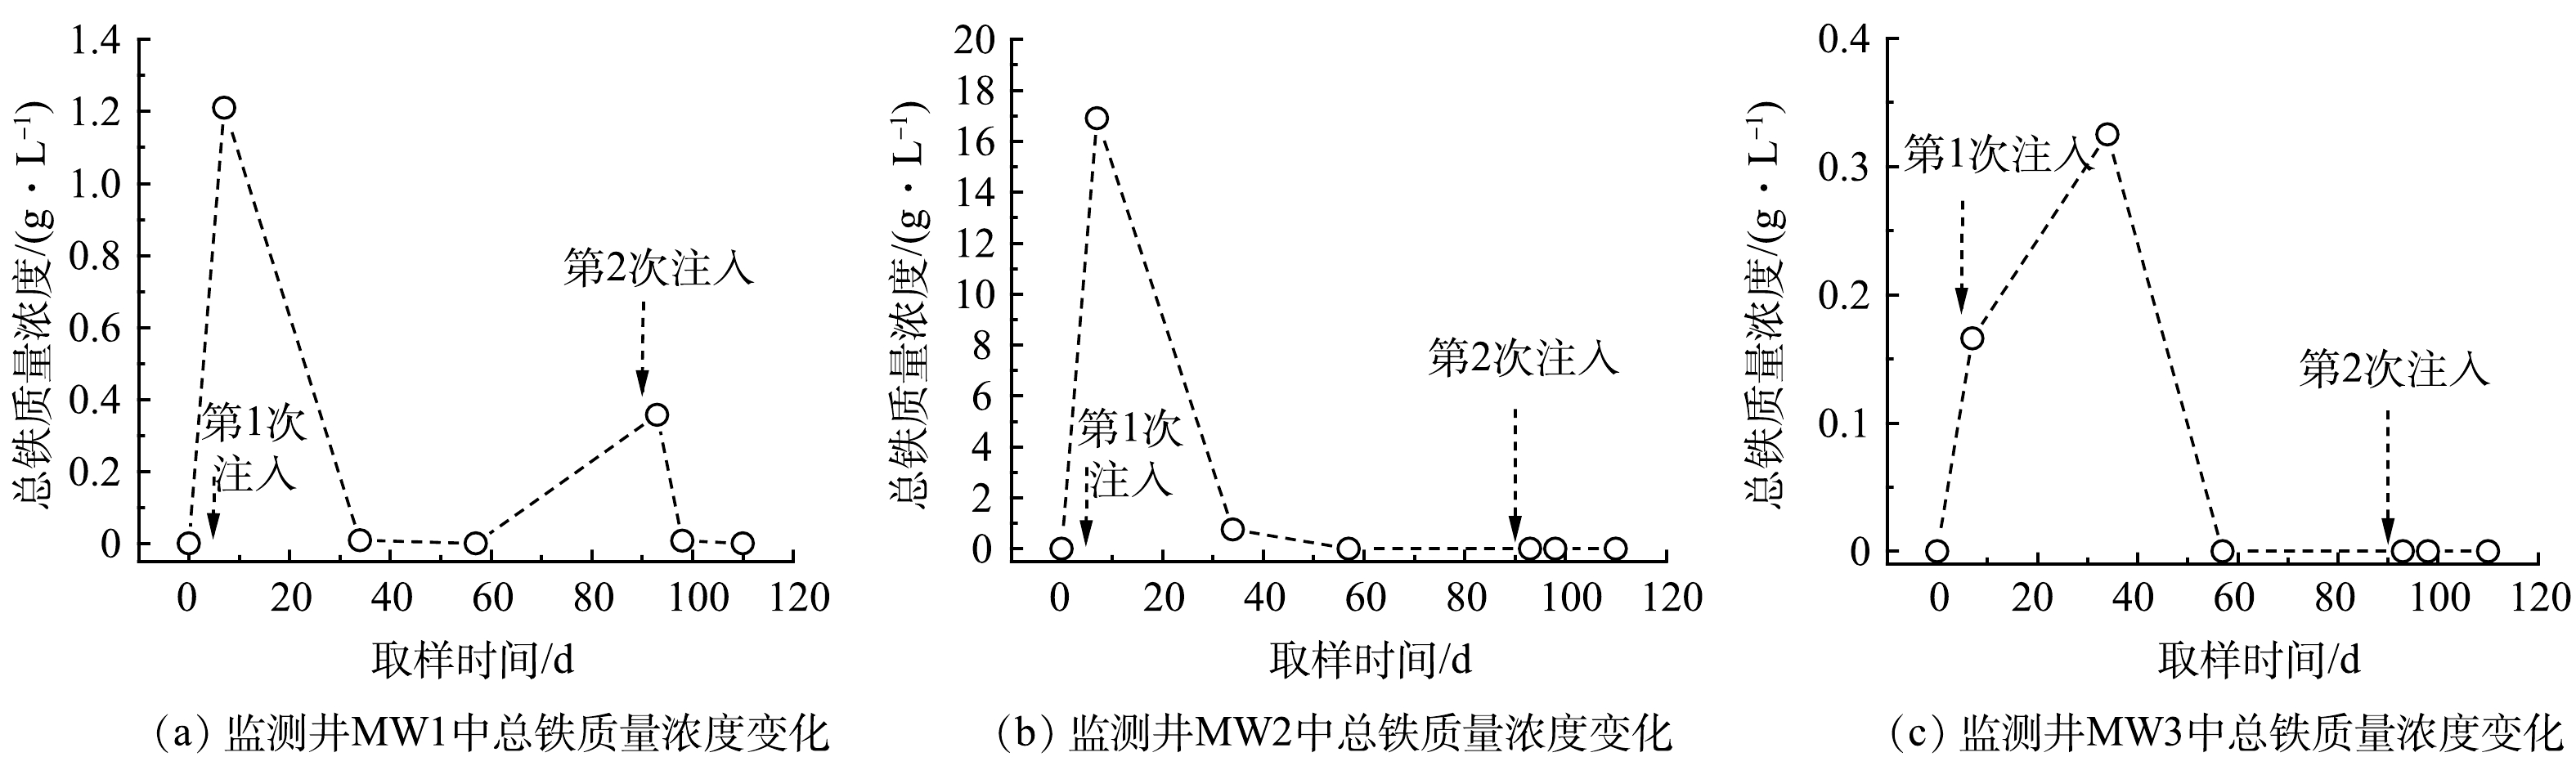
图 7 各监测井中总铁浓度的变化
Figure 7. Changes of total iron concentration in all monitoring wells
-
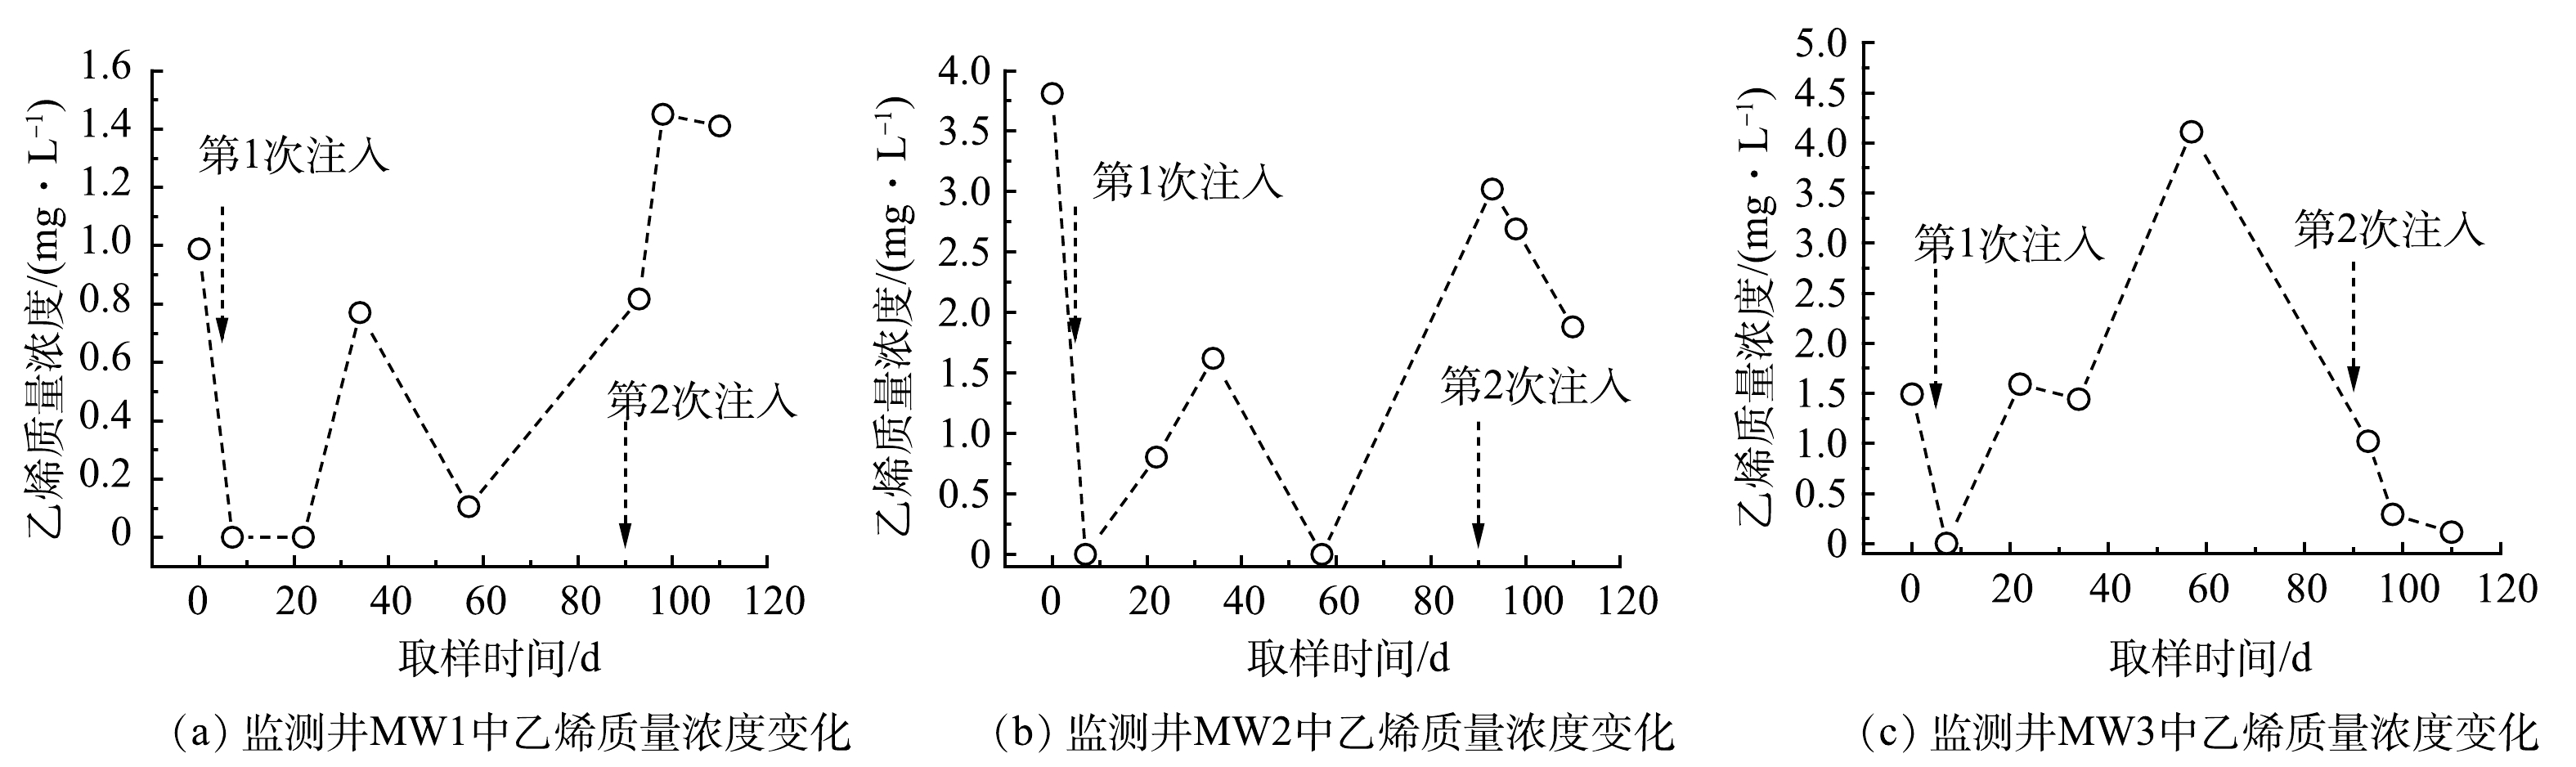
图 8 各监测井中乙烯浓度变化
Figure 8. Changes of ethene concentration in all monitoring wells
Figure
8 ,Table
2 个