-
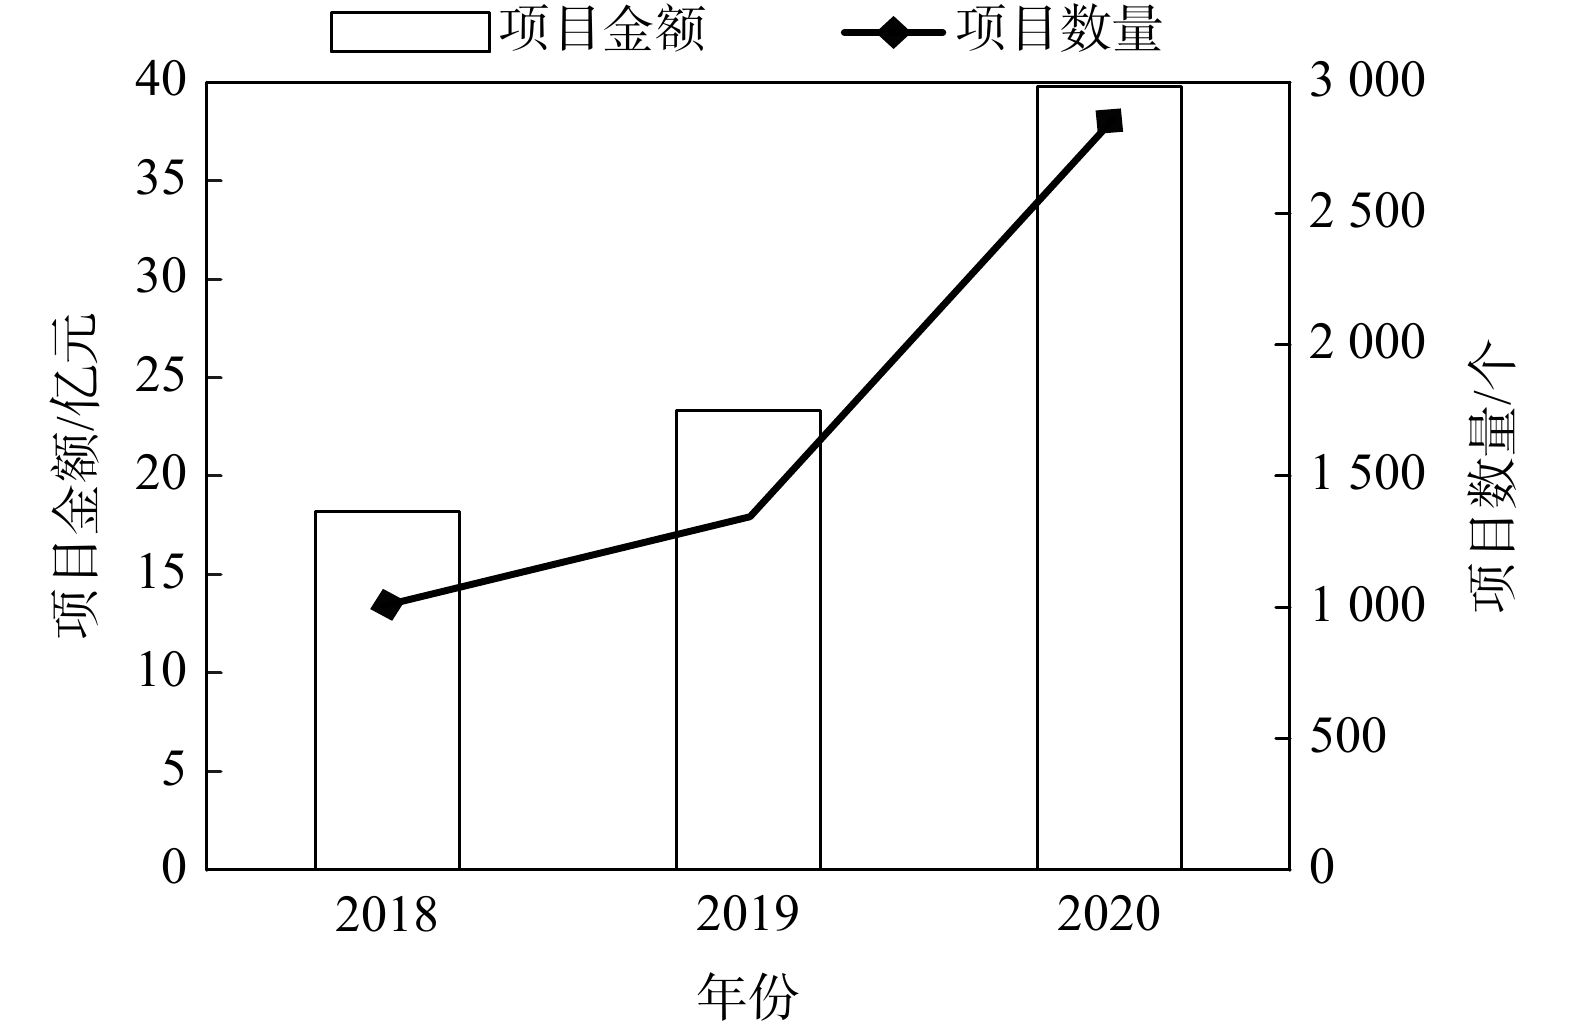
图 1 2018—2020年咨询服务项目数量和项目金额对比图
Figure 1. Comparison of quantity and amount of consulting services projects, 2018—2020
-
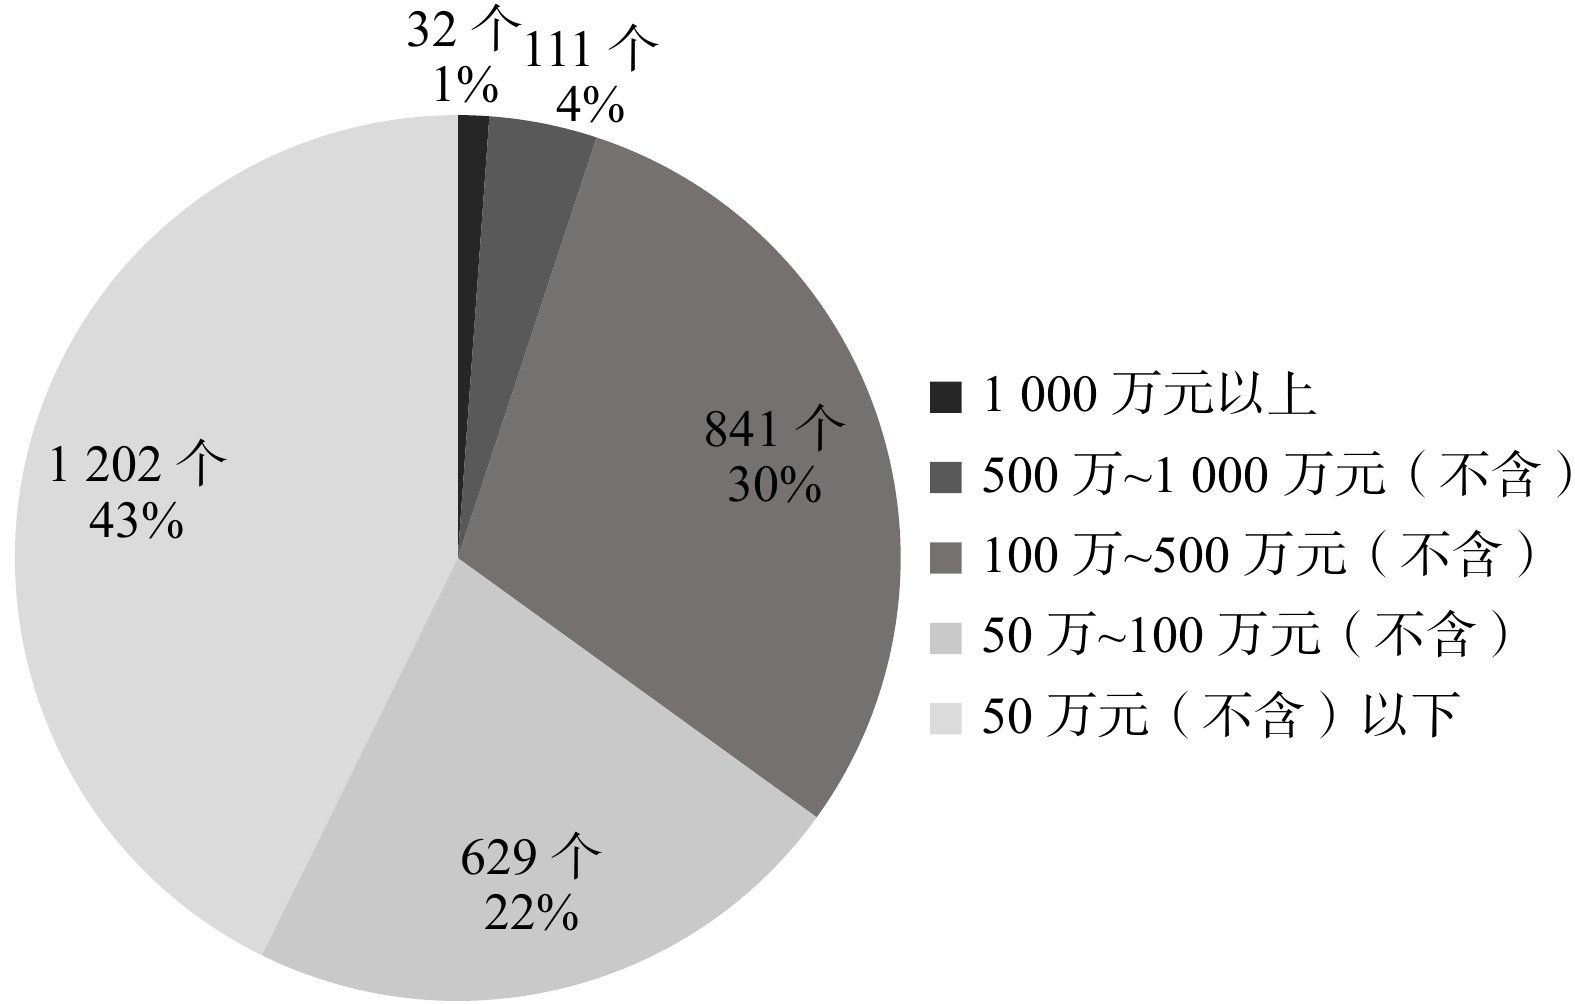
图 2 2020年不同区间的项目数量和金额占比分析图
Figure 2. Analysis of the quantity and amount of projects in different ranges in 2020
-
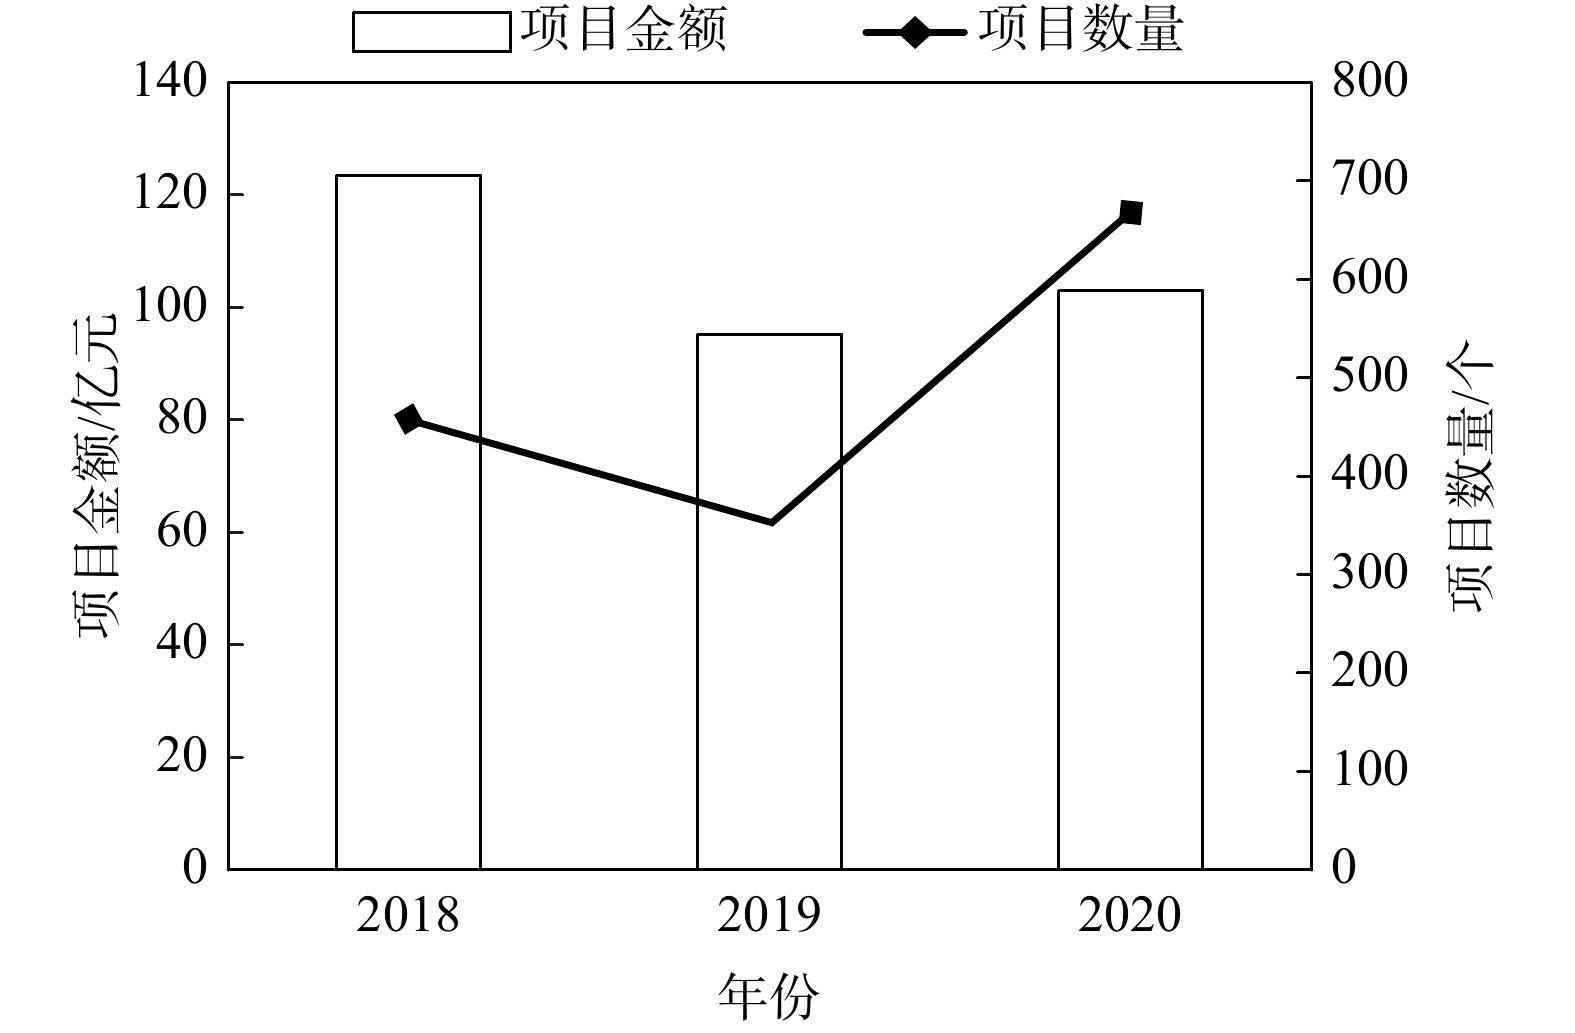
图 3 2018—2020年土壤修复工程项目数量和项目金额对比
Figure 3. Comparison of the quantity and amount of soil remediation projects 2018—2020
-
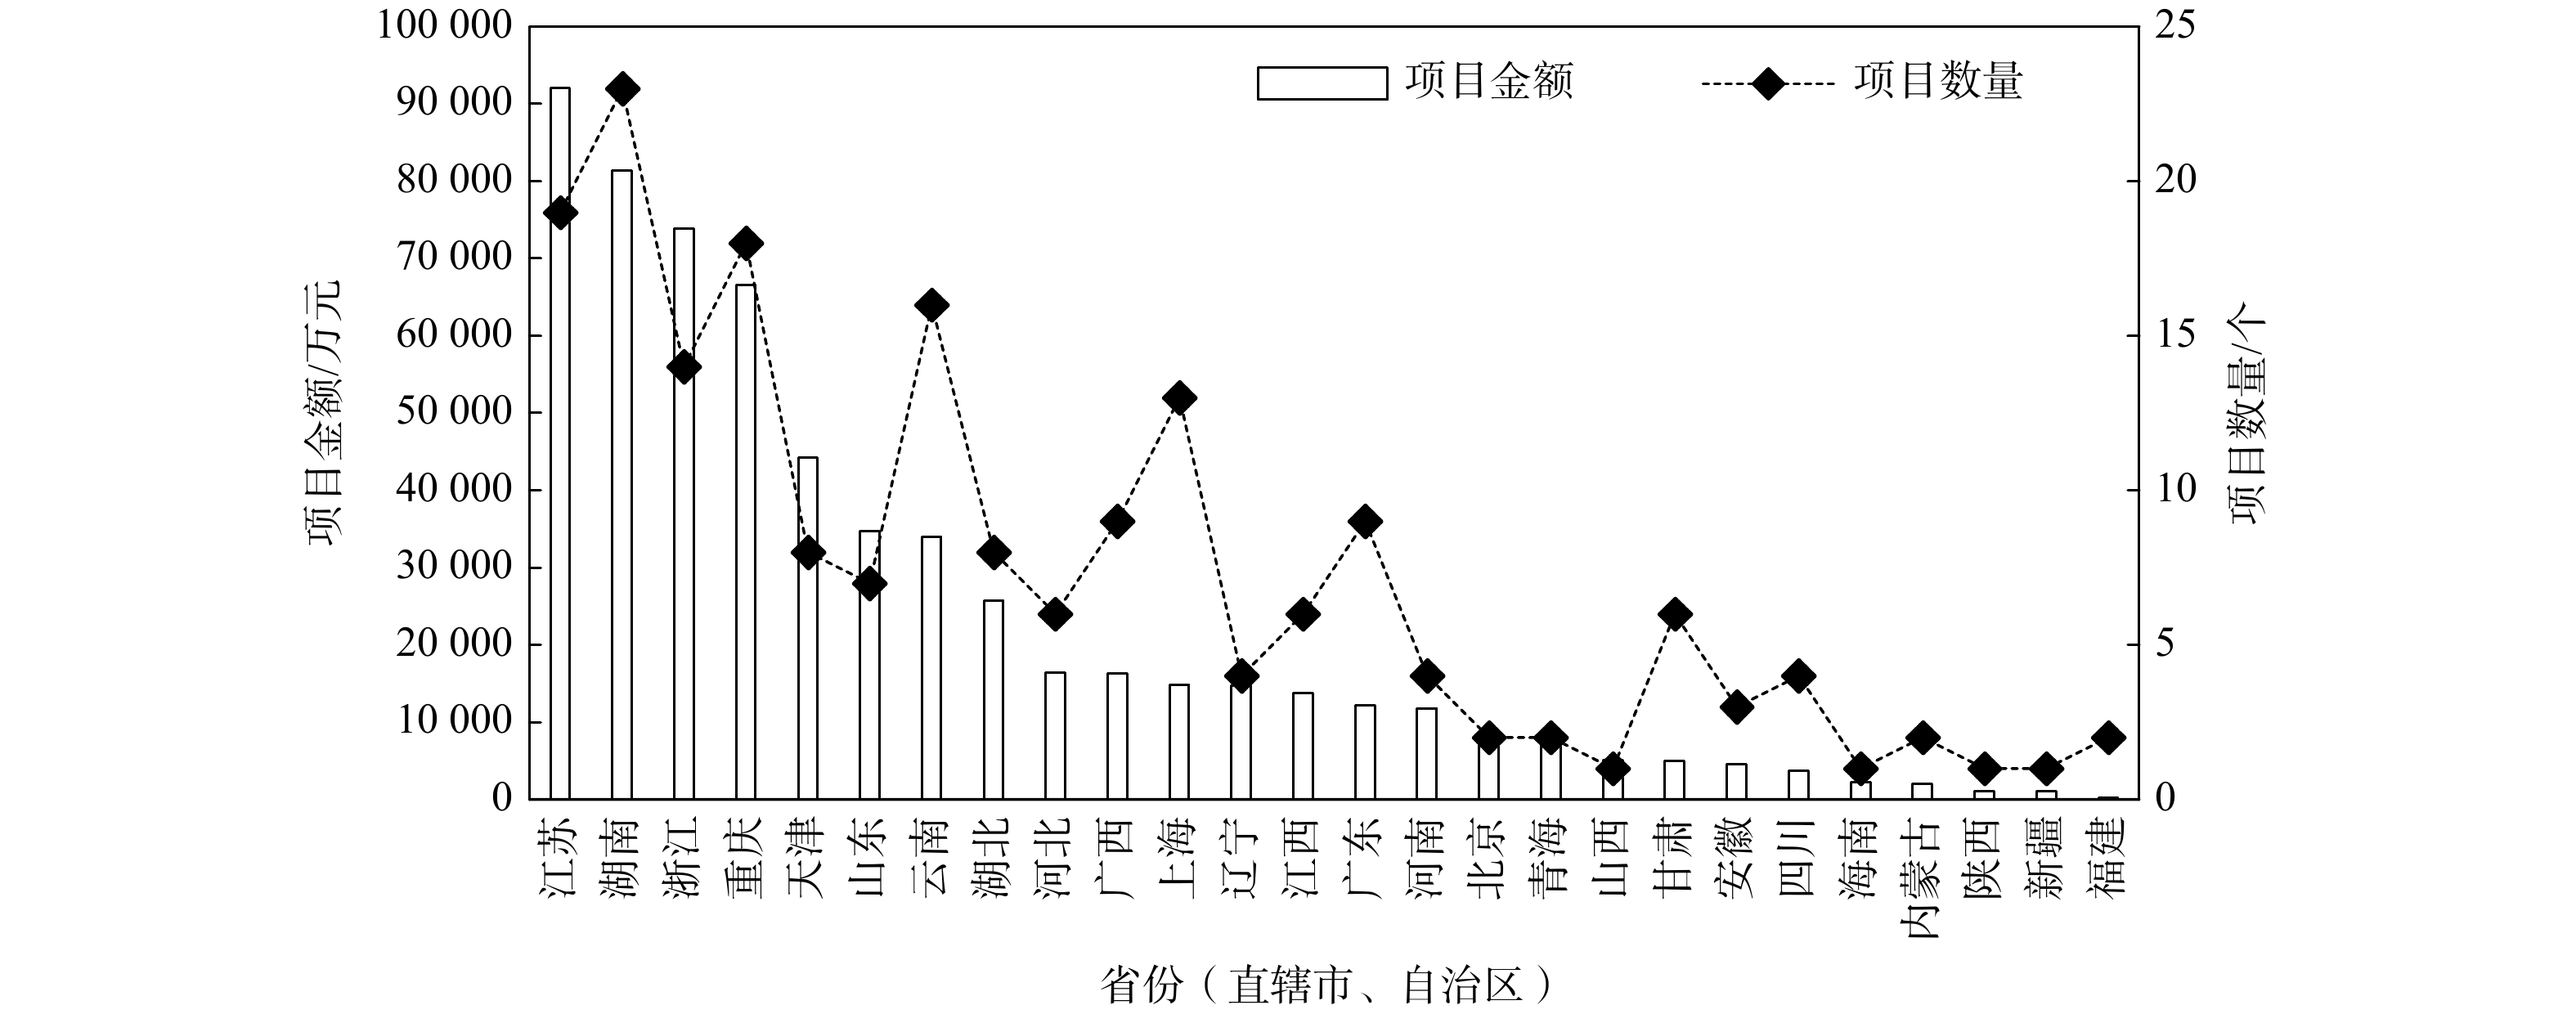
图 4 2020年各省(直辖市、自治区)工业场地修复工程项目数量和金额对比图
Figure 4. Comparison of the quantity and amount of industrial site remediation projects in each province (municipalities and autonomous region) in 2020
-
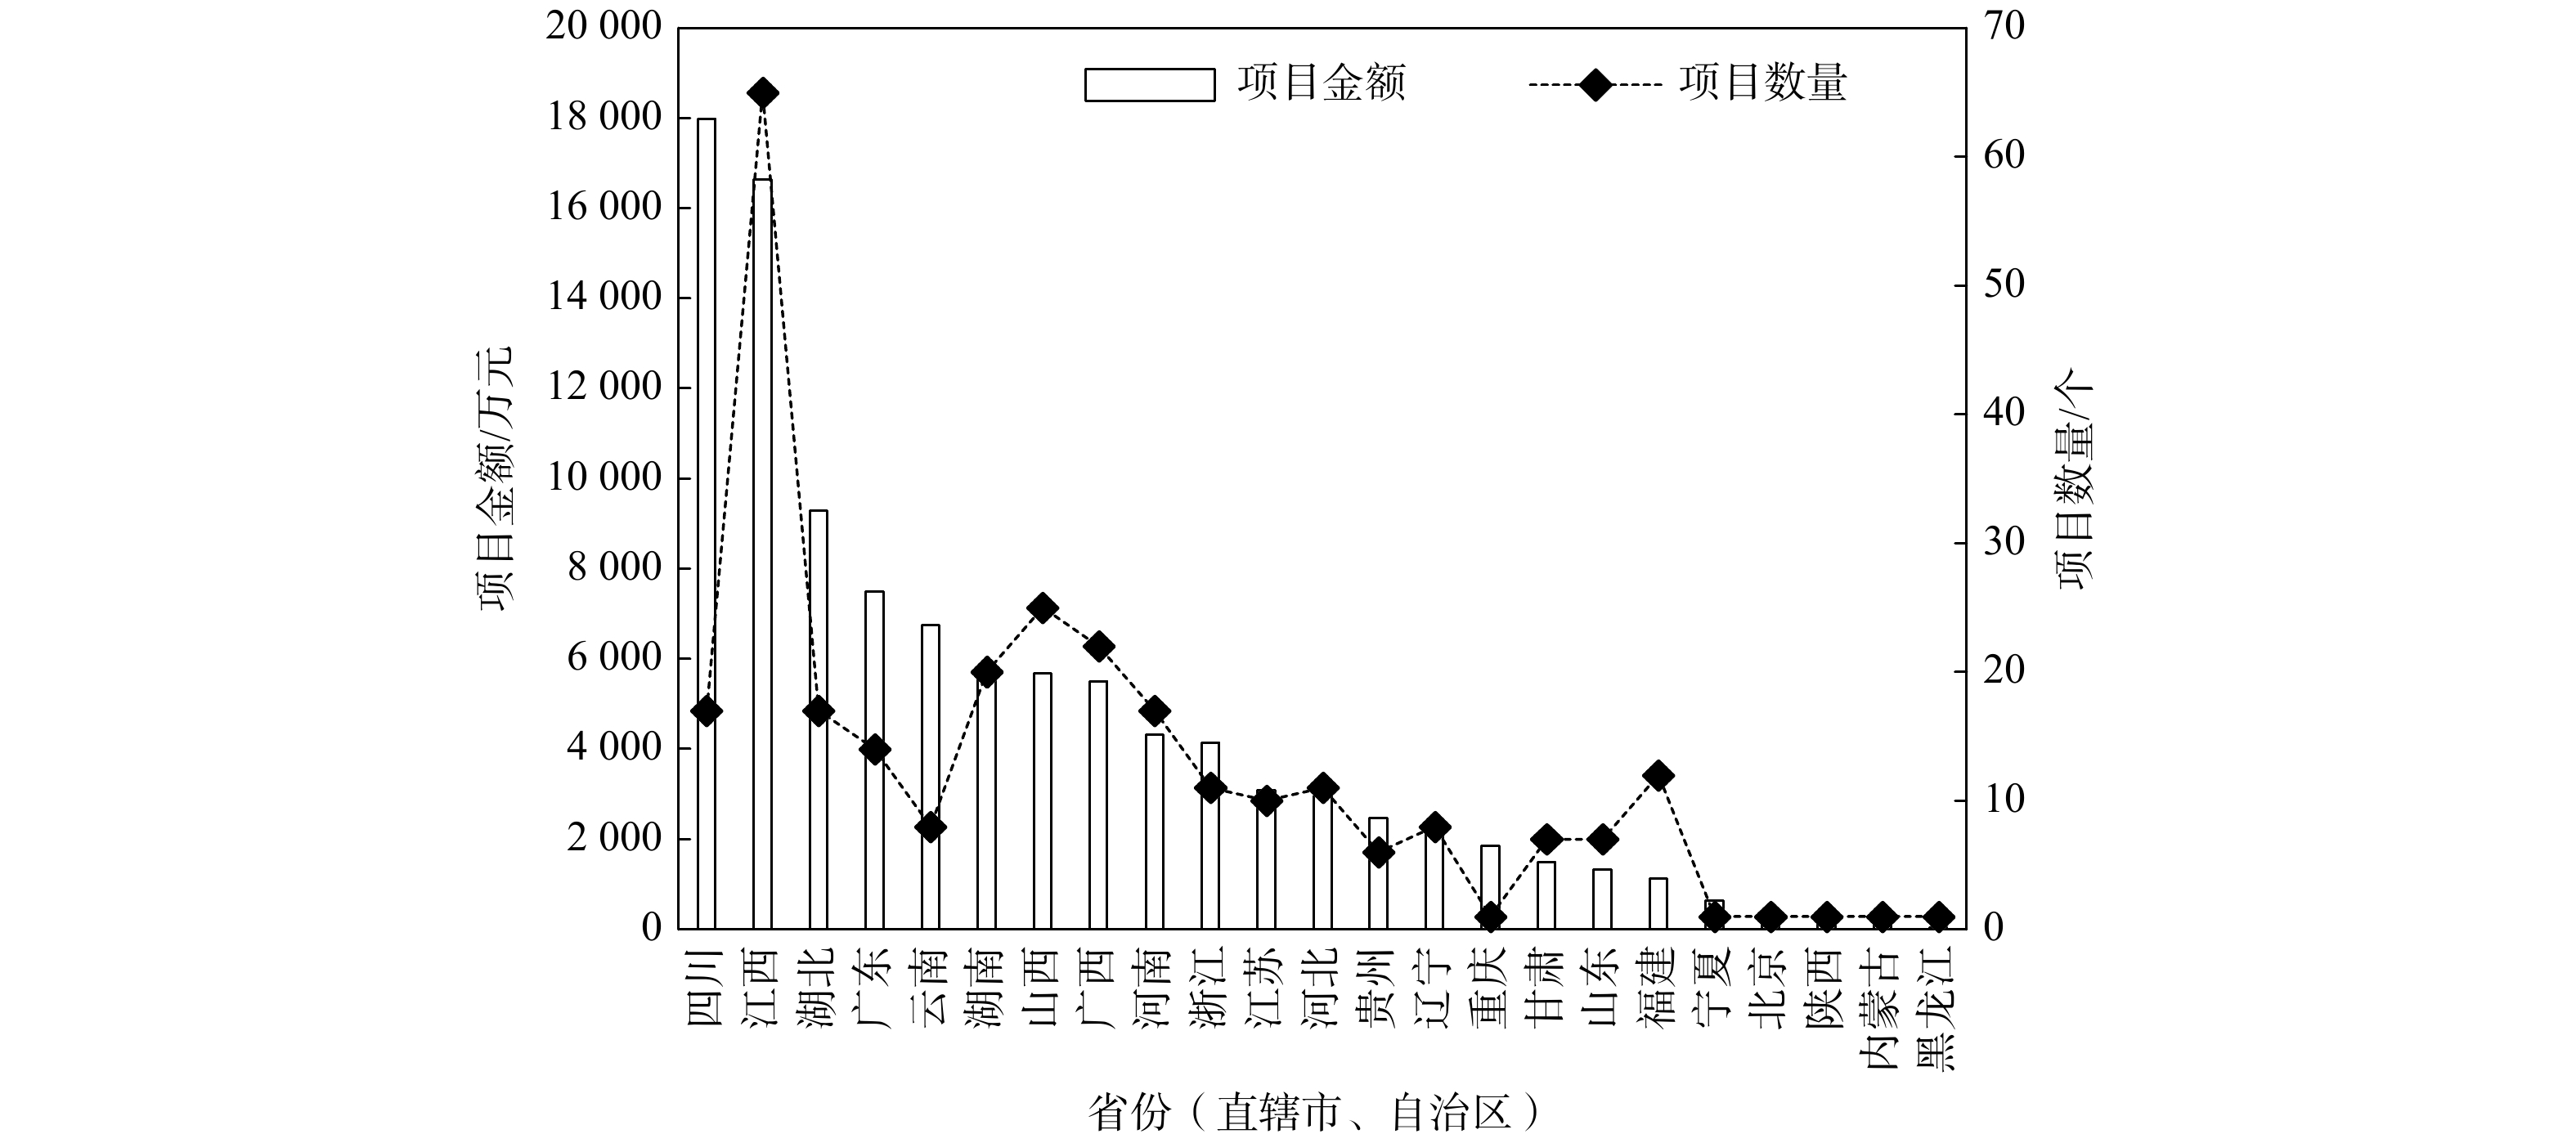
图 5 2020年各省(直辖市、自治区)农用地类型项目数量和金额对比
Figure 5. Comparison of the quantity and amount of agricultural remediation projects in each province (municipalities and autonomous region) in 2020
Figure
5 ,Table
3 个