-
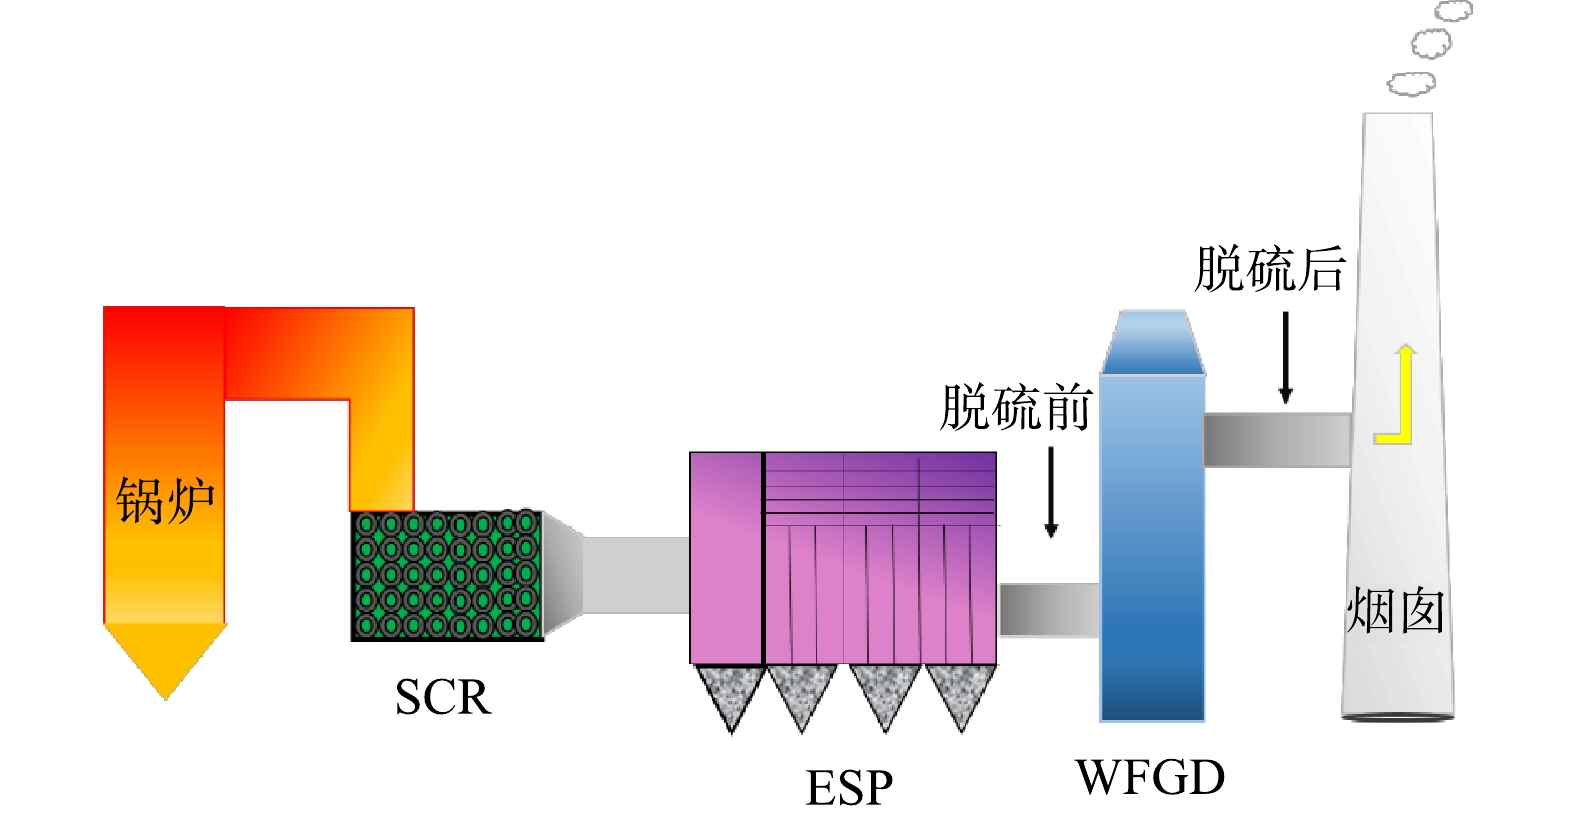
图 1 企业的烟气处理流程图及采样位置
Figure 1. Flow chart and sampling locations of the plants
-
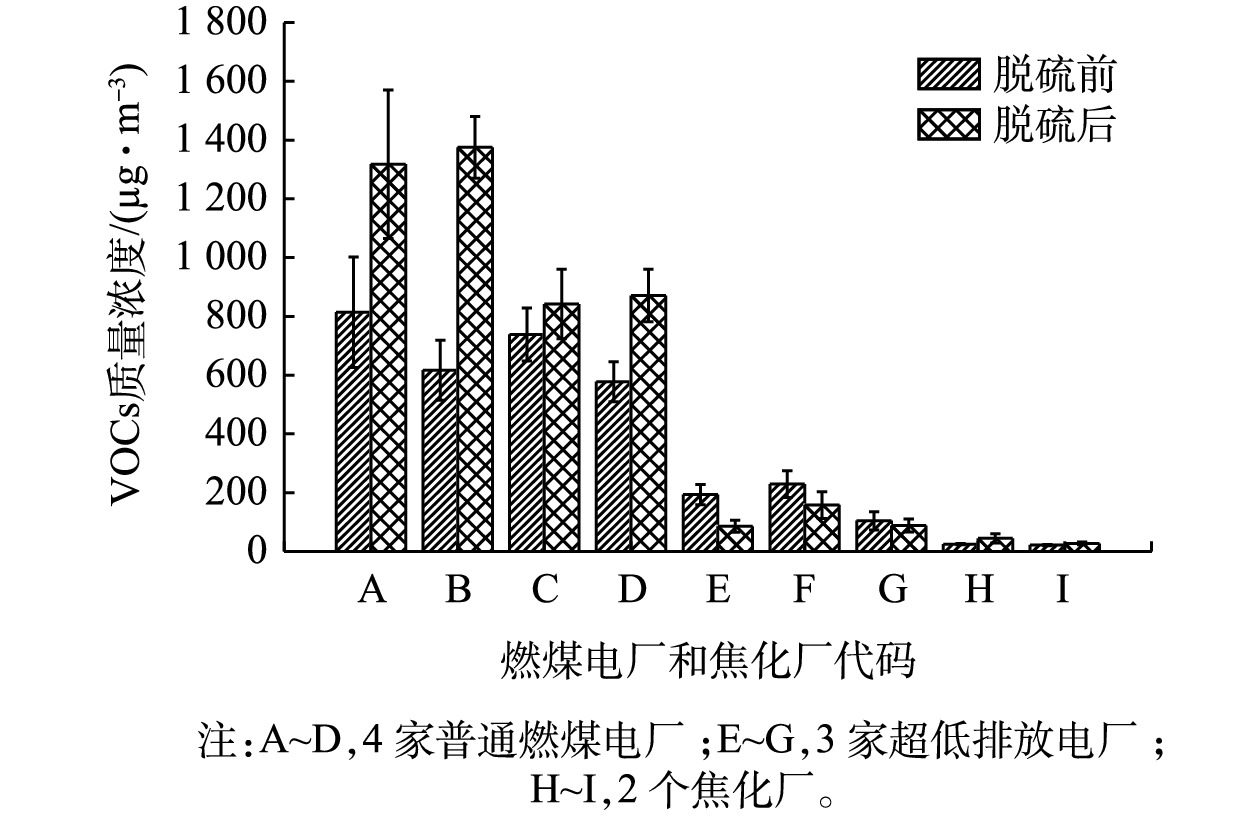
图 2 9家工厂脱硫前后的VOCs的质量浓度
Figure 2. Mass concentrations of VOCs at the inlet and outlet of the WFGD
-
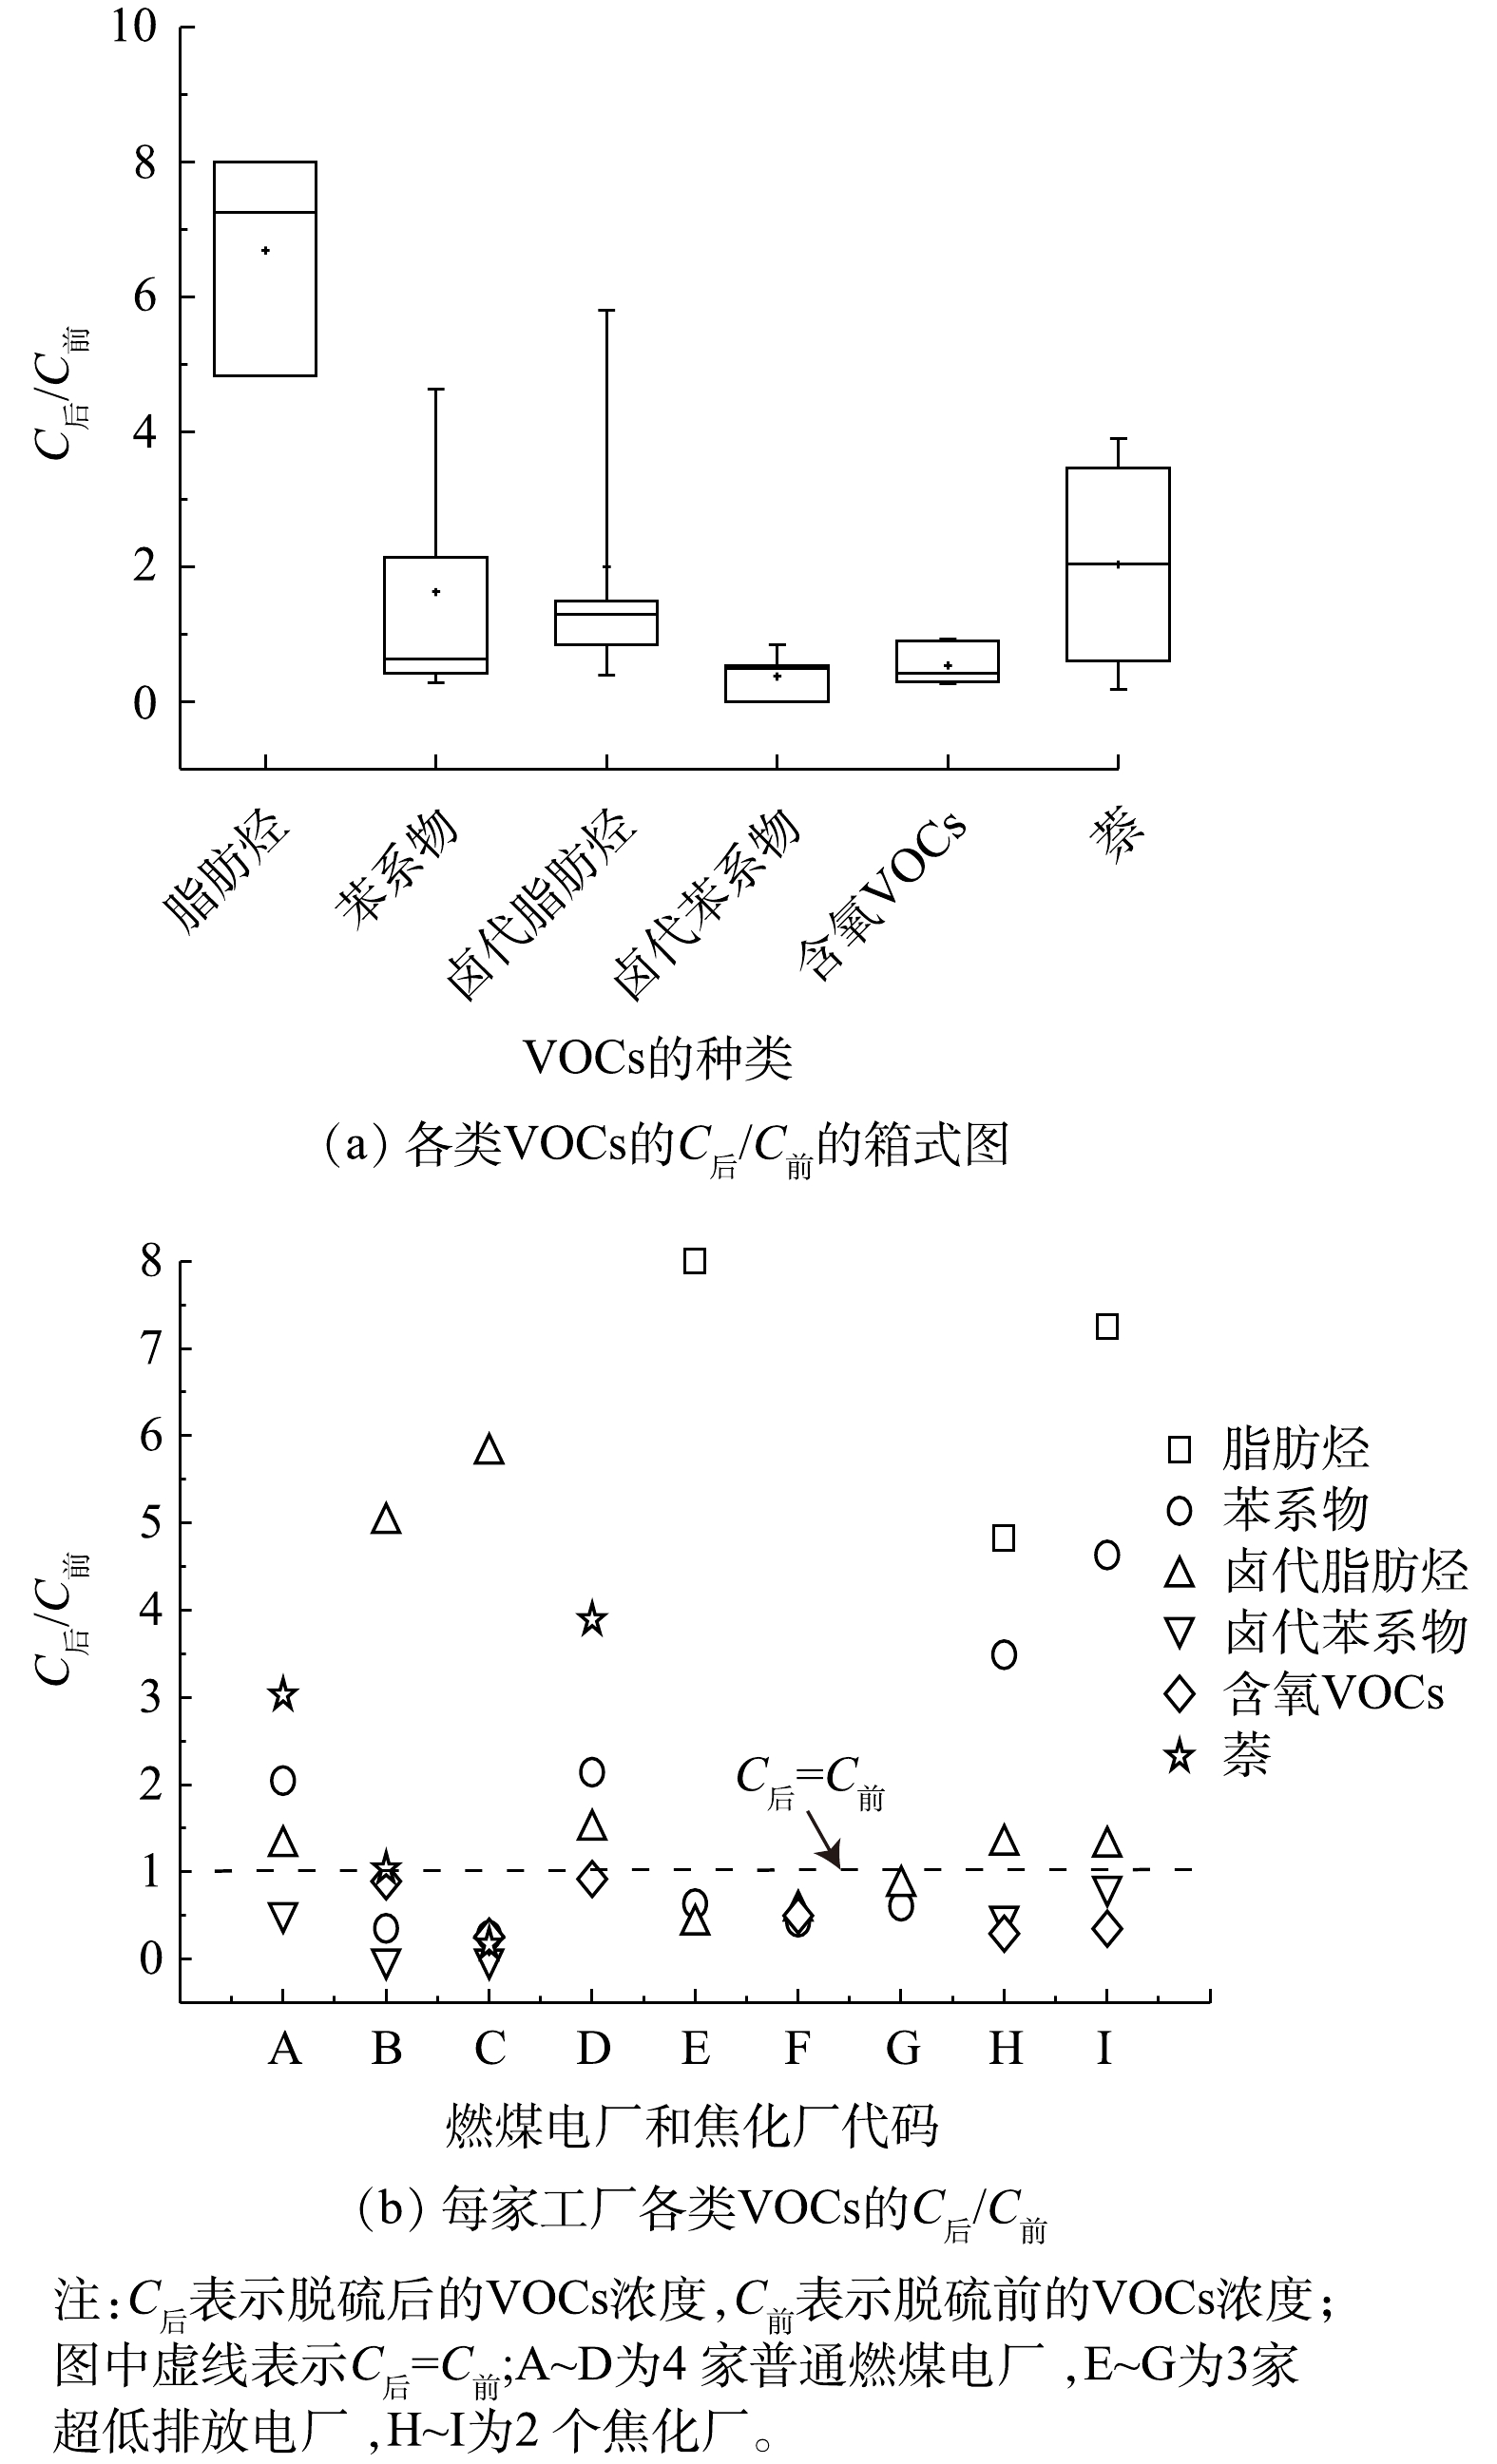
图 3 脱硫设施对不同类VOCs的影响
Figure 3. Effect of WFGD on the removal of different types of VOCs
-

图 4 不同种类VOCs的OFP在总OFP中的占比
Figure 4. Percentage of OFPs of different types VOCs in total OFPs
-
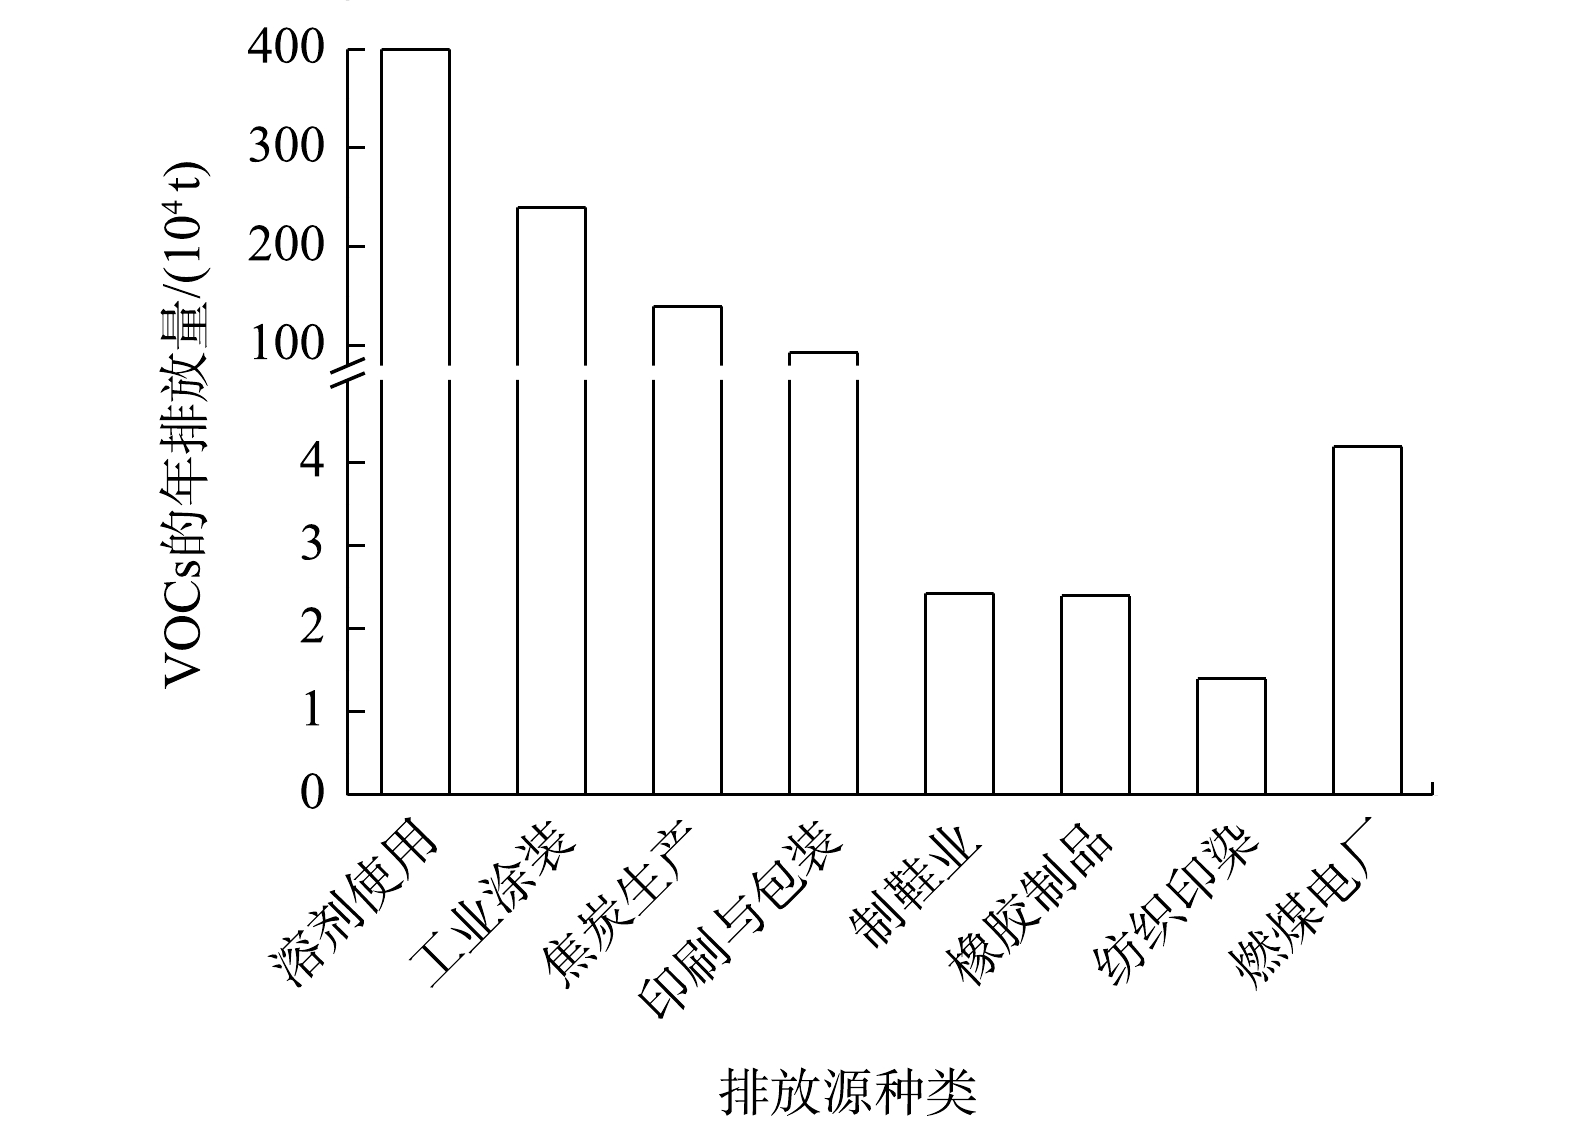
图 5 典型工业排放源的VOCs排放量
Figure 5. VOCs emissions from typical industrial emission sources
Figure
5 ,Table
2 个