-
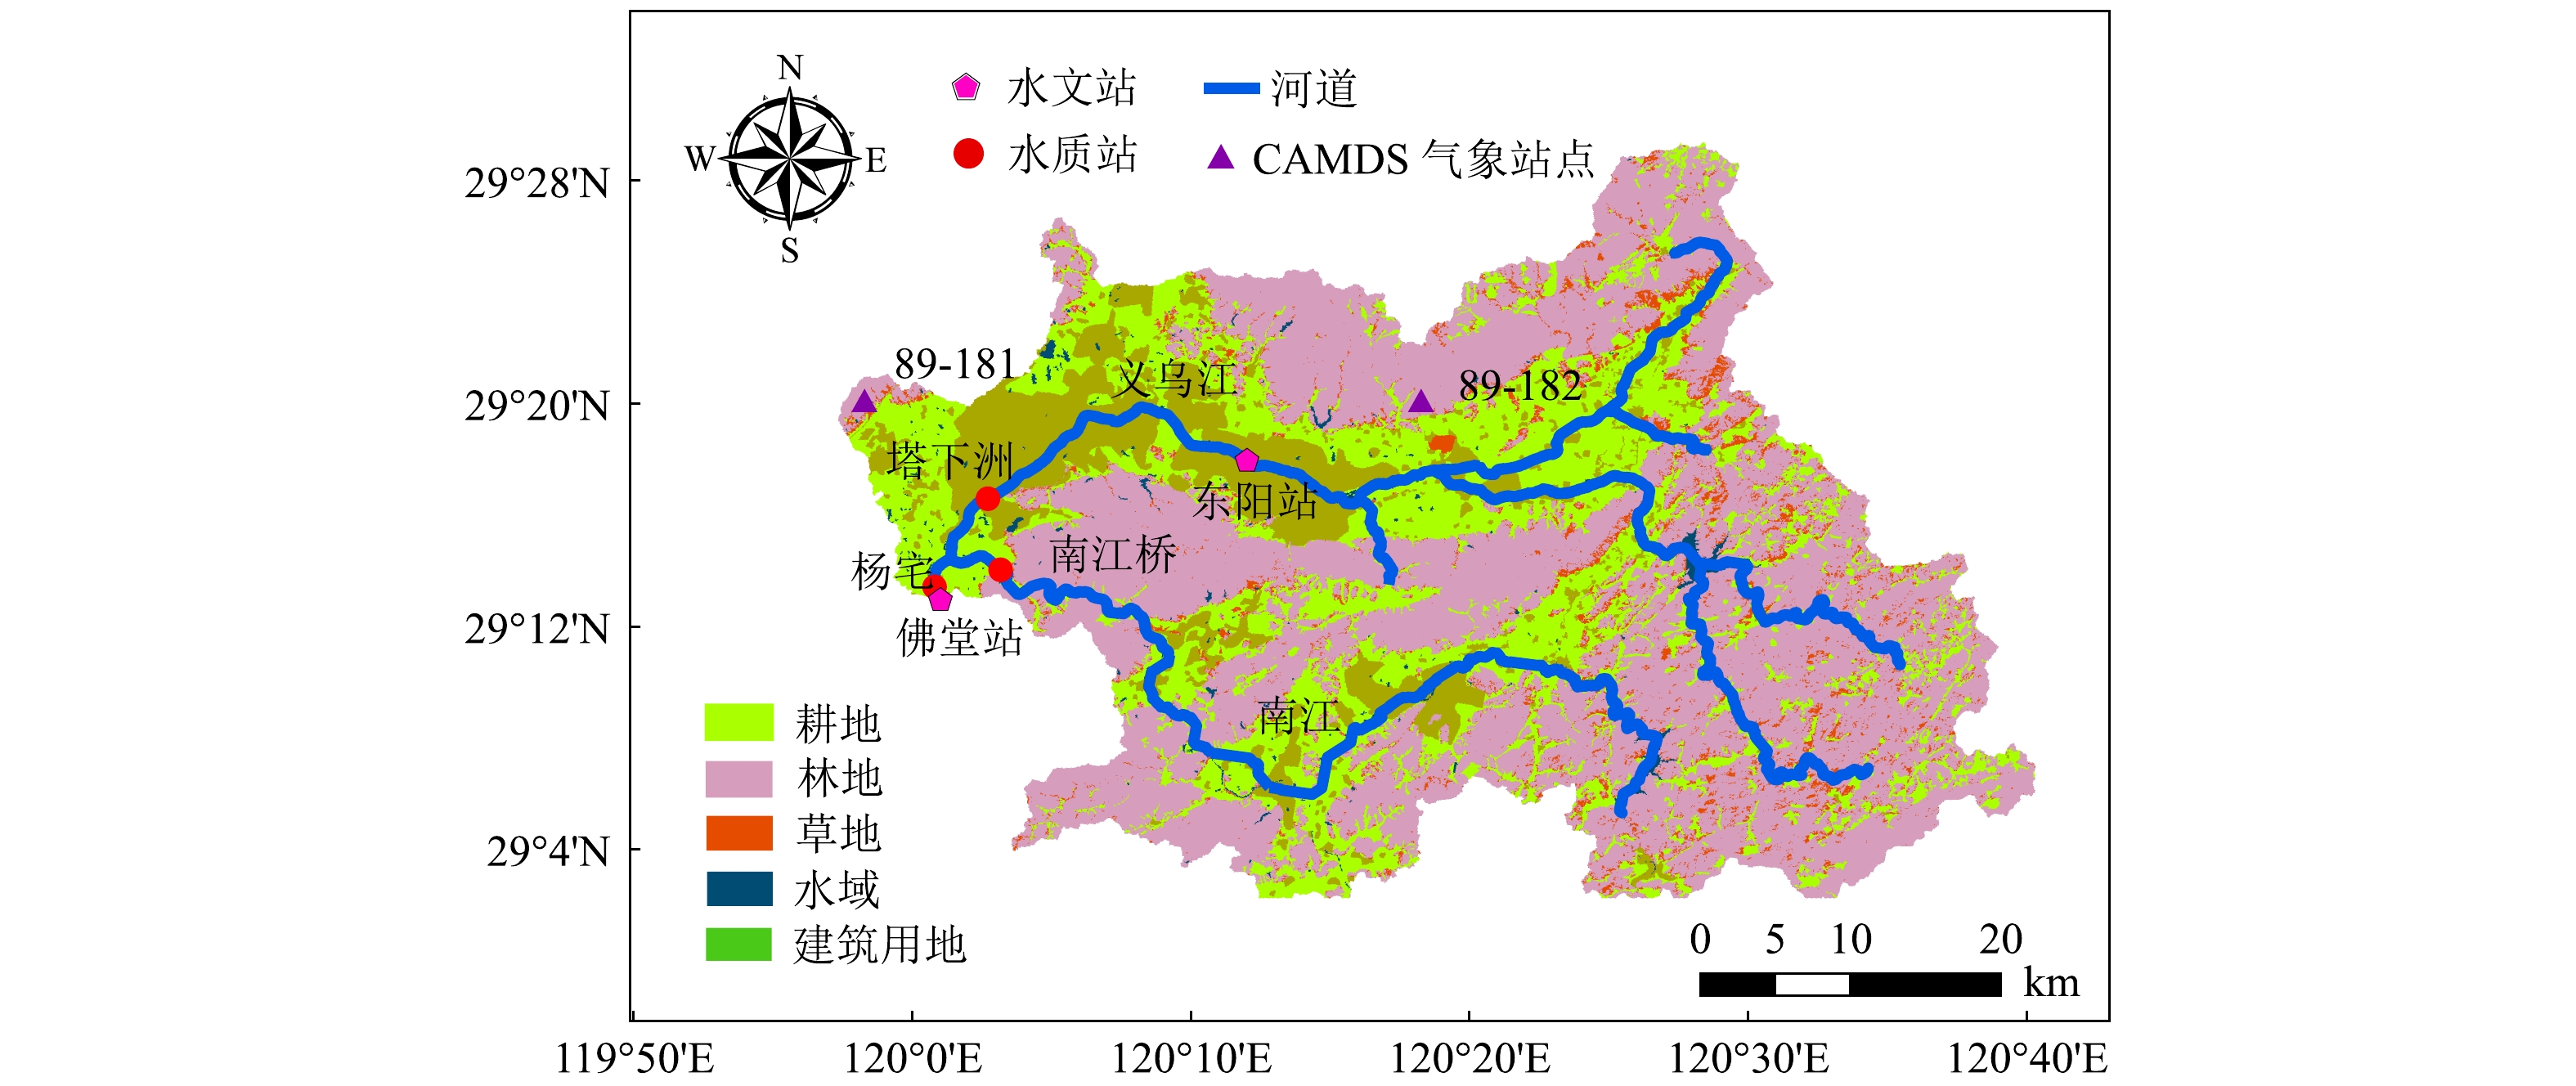
图 1 研究区域位置
Figure 1. Location of the study area
-
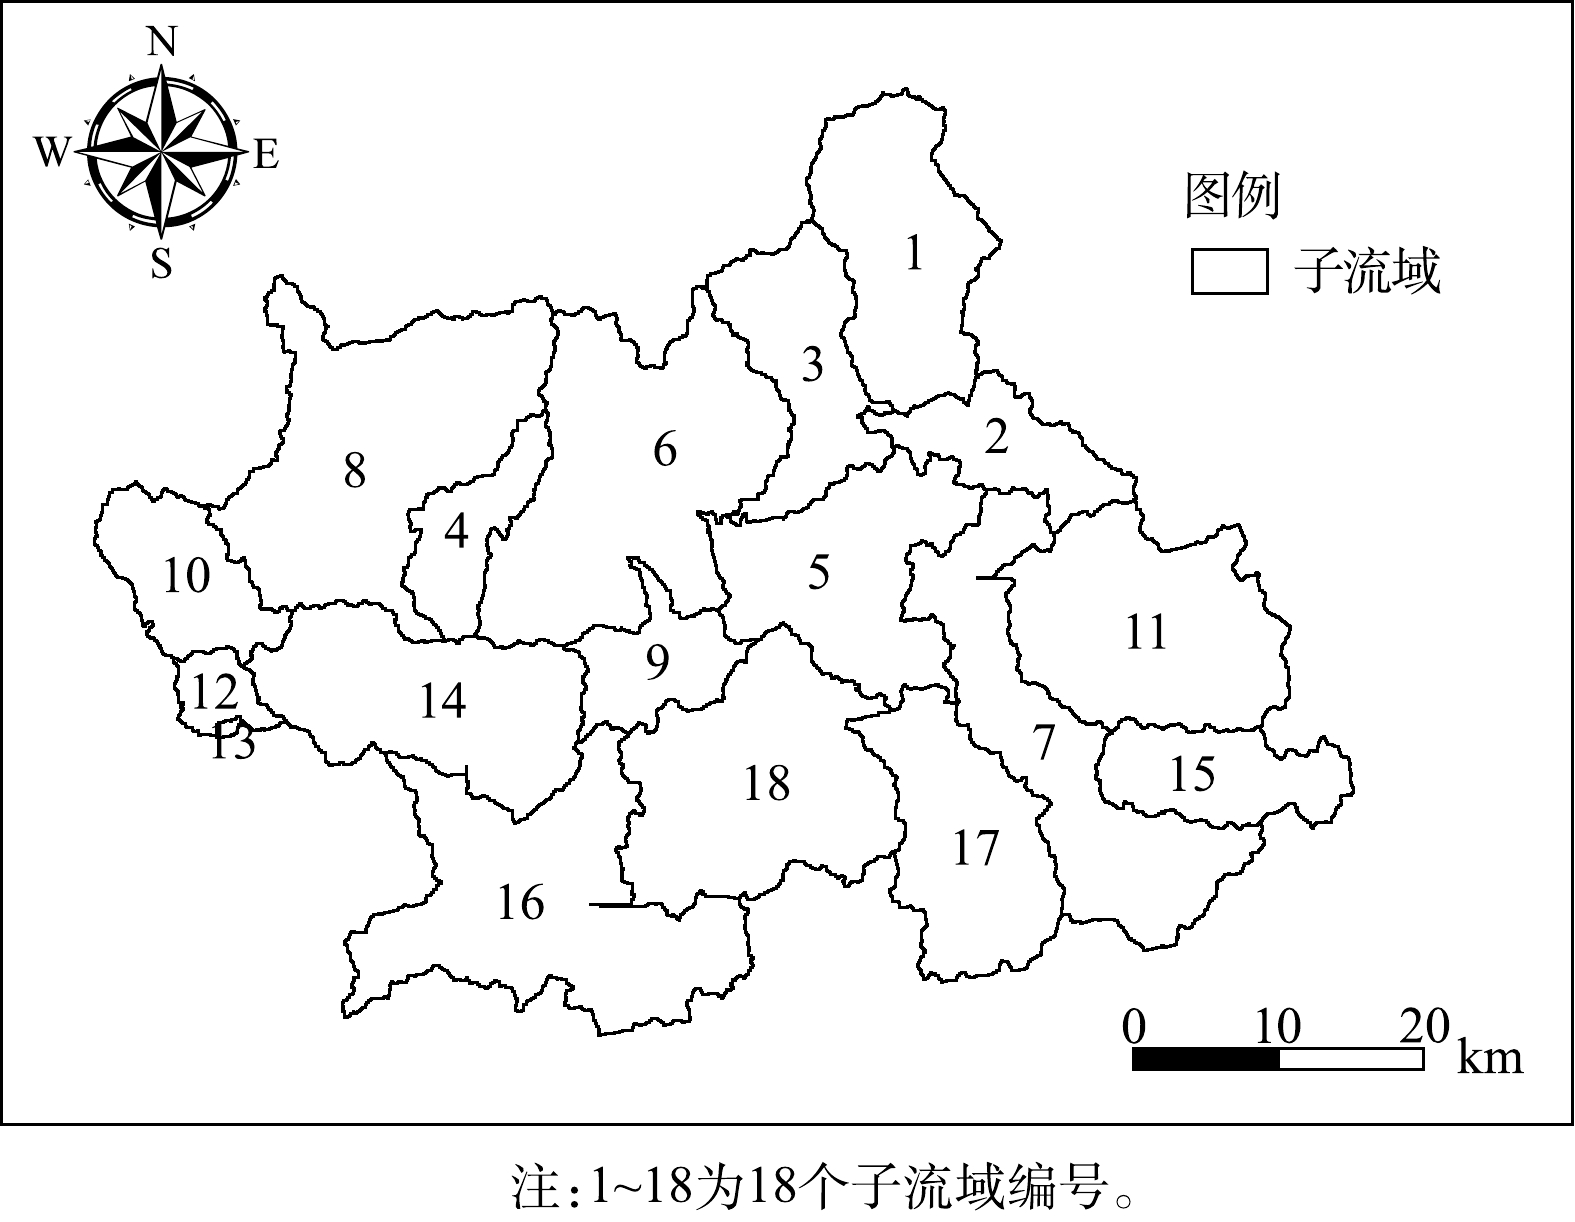
图 2 子流域与水文响应单元划分
Figure 2. Division of subbasins and hydrological response units
-
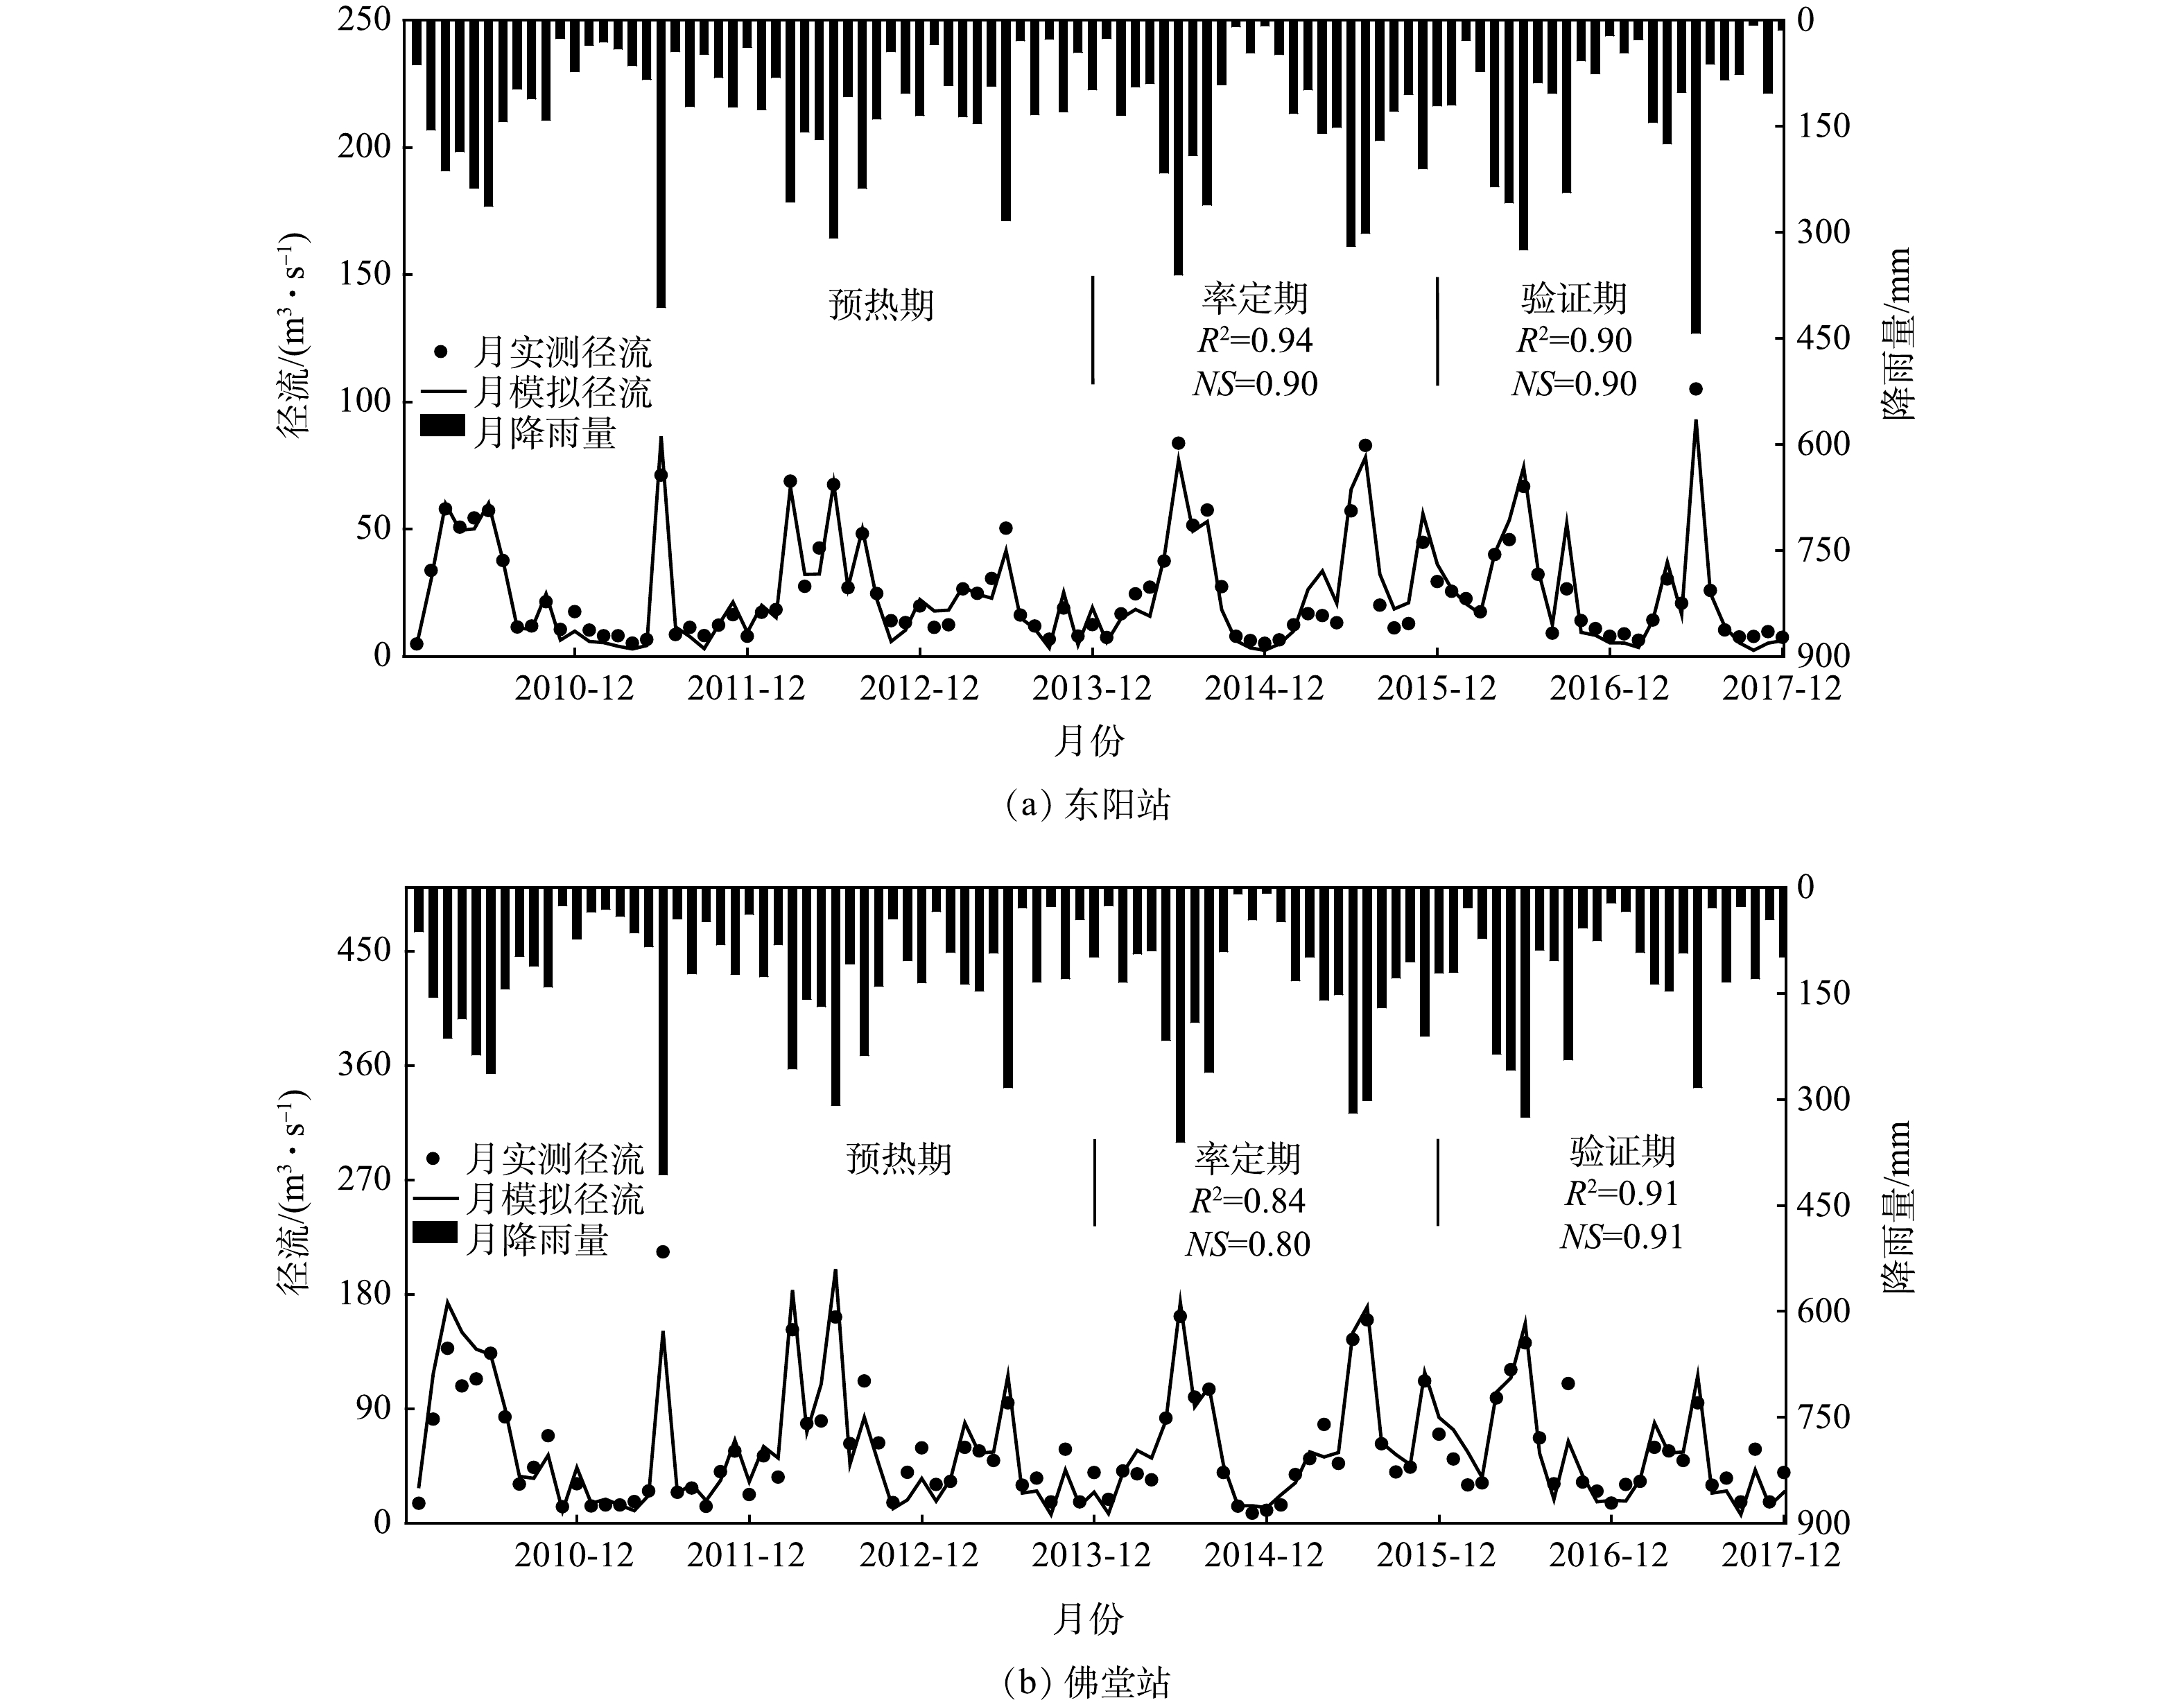
图 3 东阳站和佛堂站逐月径流模拟与实测对比
Figure 3. Comparison of the simulated and observed monthly runoff of Dongyang station and Fotang station
-

图 4 佛堂站逐月泥沙负荷模拟值与实测值对比
Figure 4. Comparison of simulated and observed monthly sediment load at the Fotang station
-
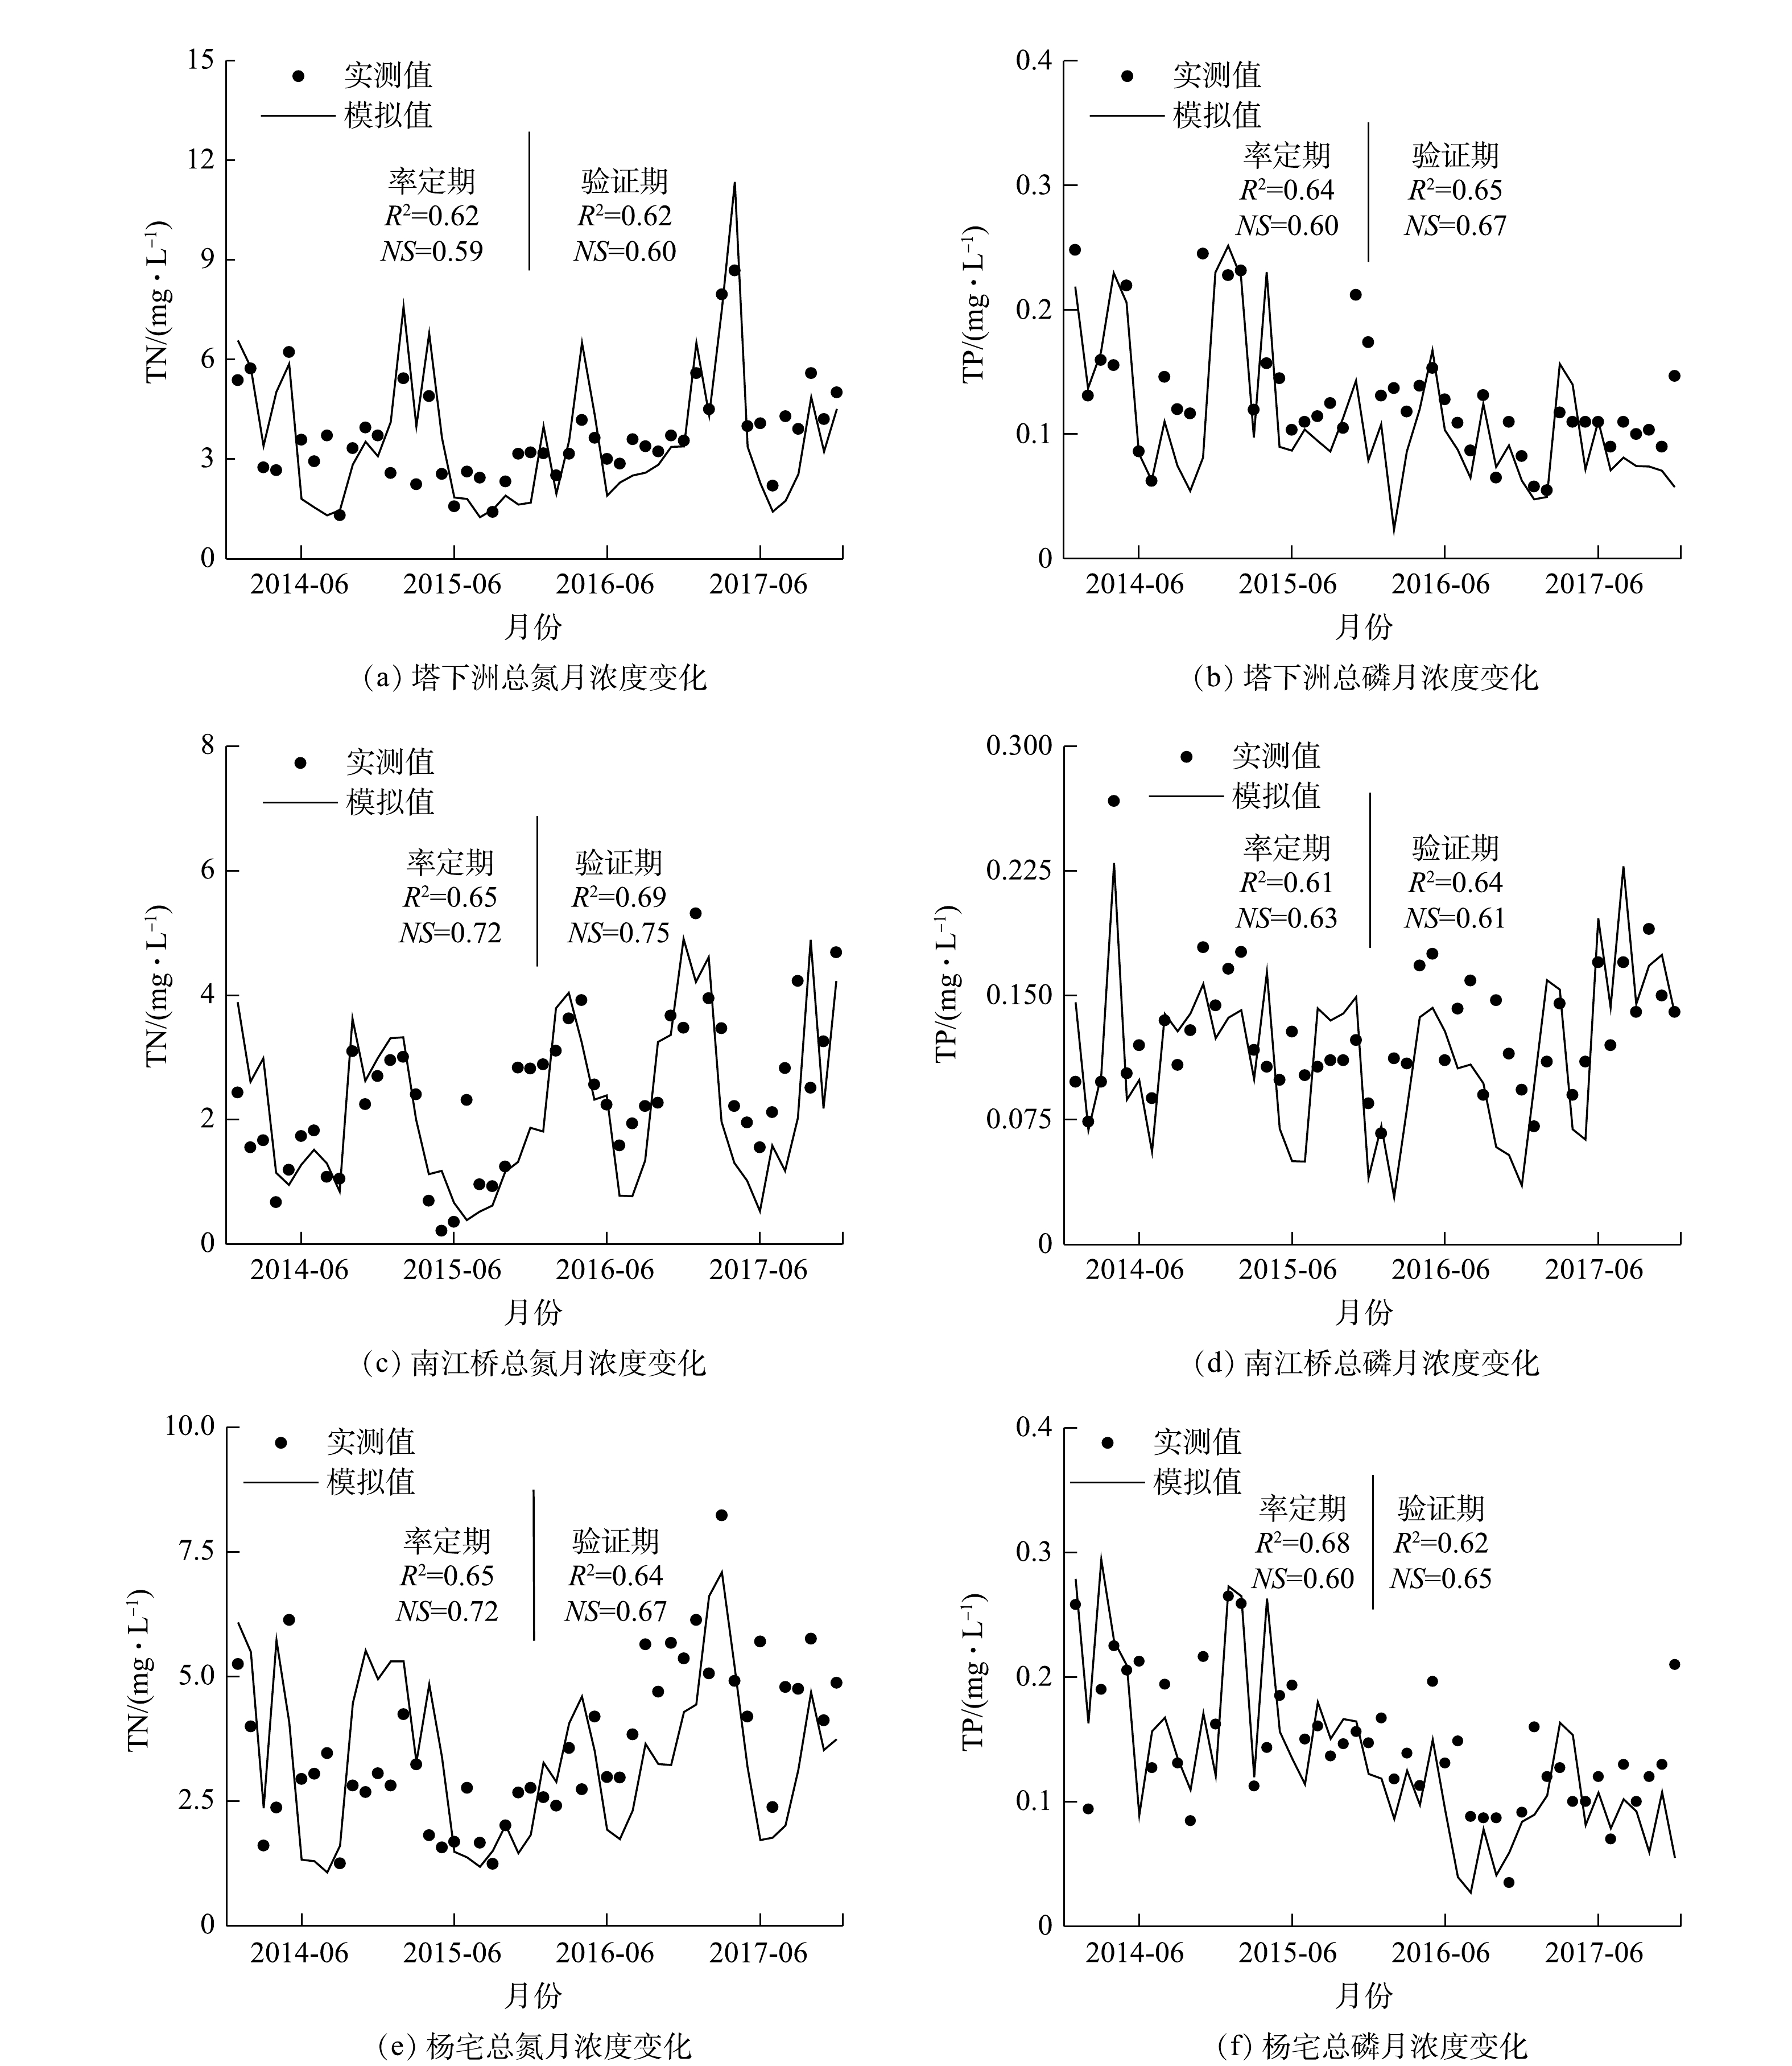
图 5 塔下洲、南江桥和杨宅总氮、总磷逐月浓度实测值与模拟值对比
Figure 5. Comparison of the simulated and measured monthly values of nitrogen and phosphorus concentration of Taxiazhou, Nanjiangqiao and Yangzhai
-
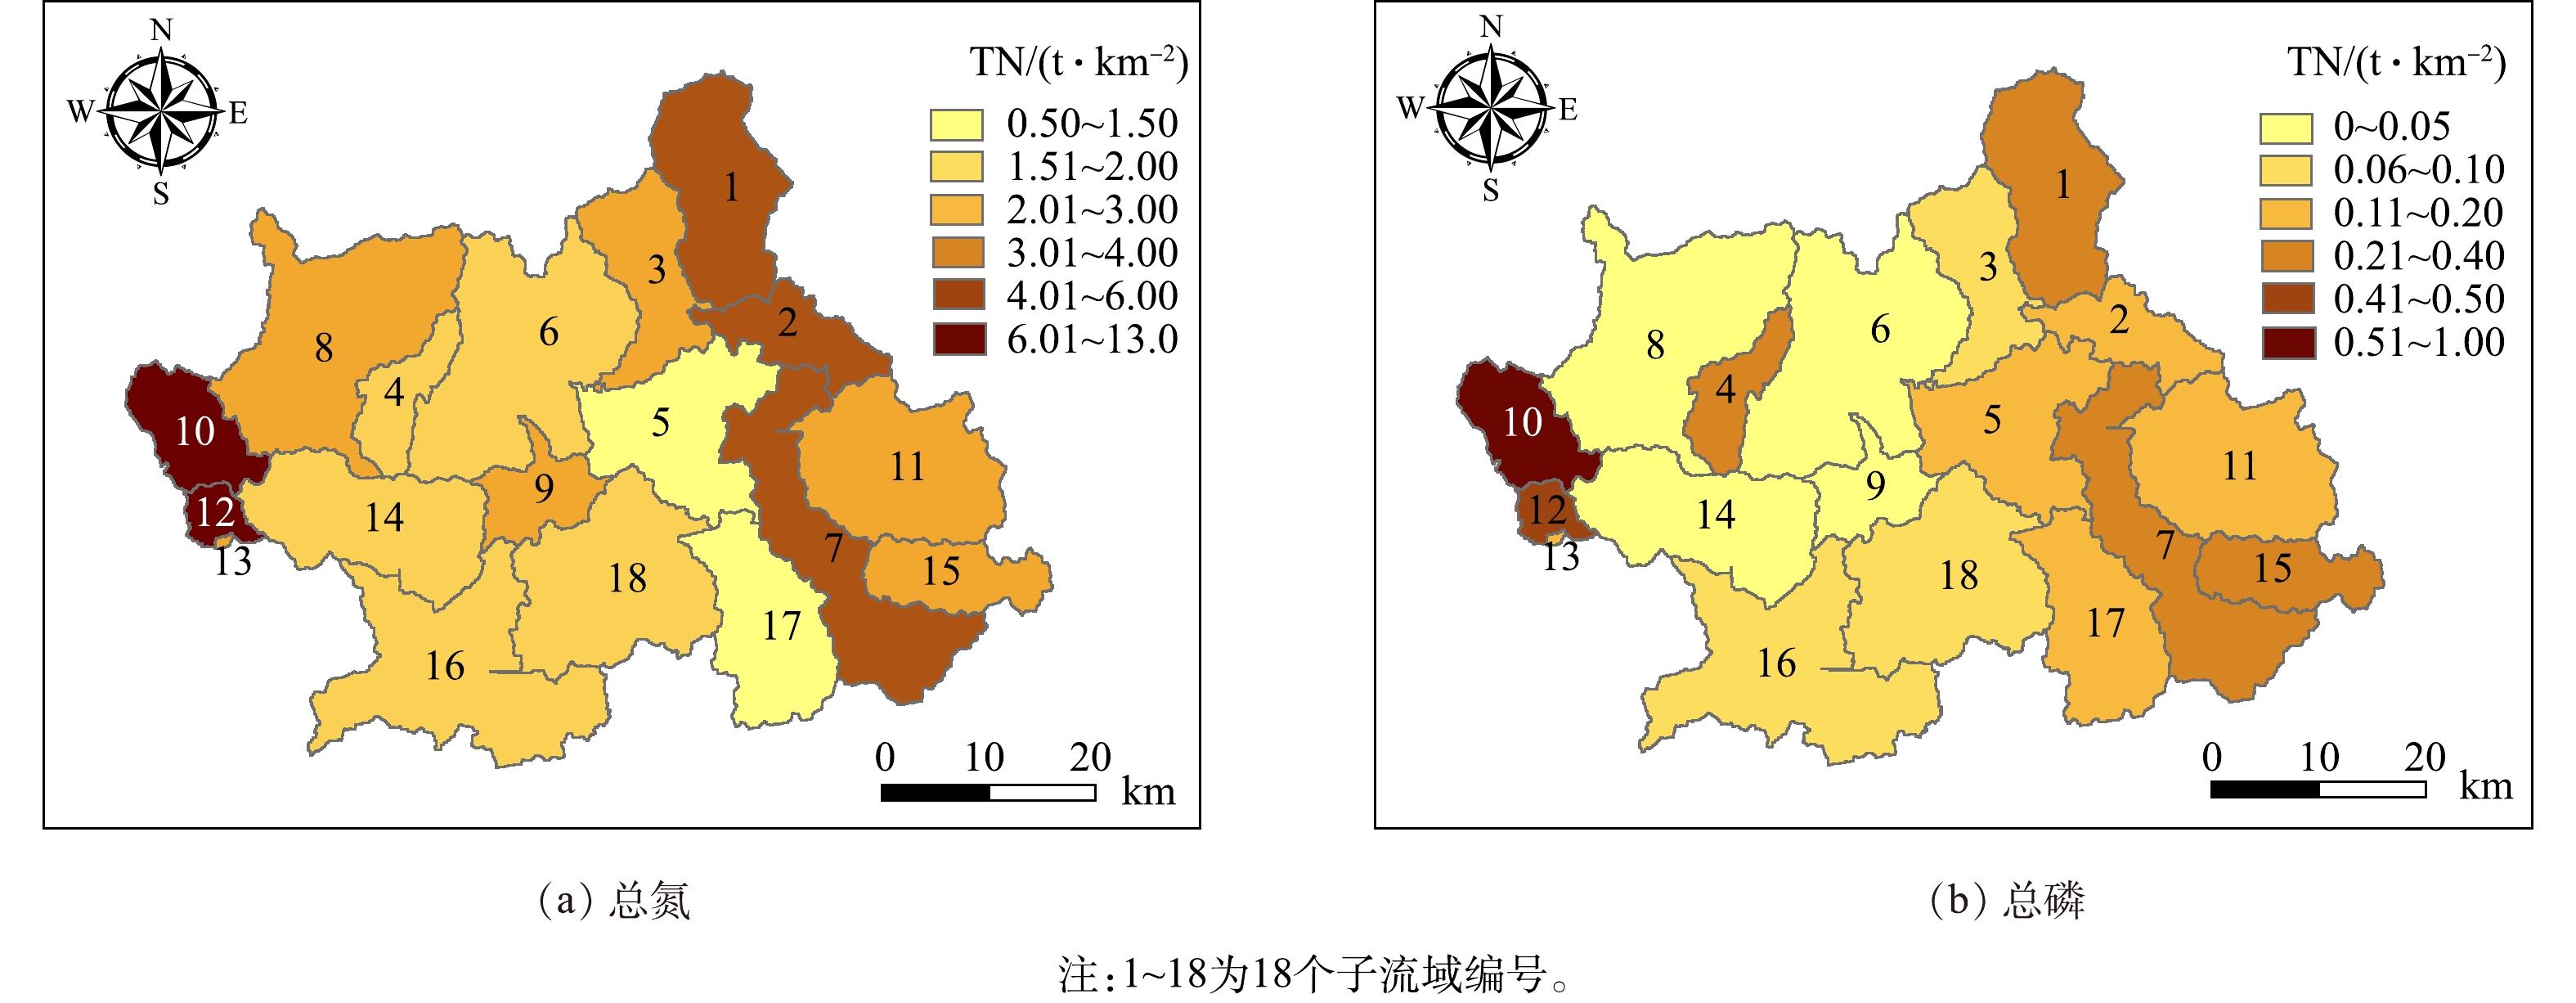
图 6 义乌江流域年均总氮和总磷的空间分布
Figure 6. Spatial distribution of annual total nitrogen total phosphorus load in Yiwu River Basin
-
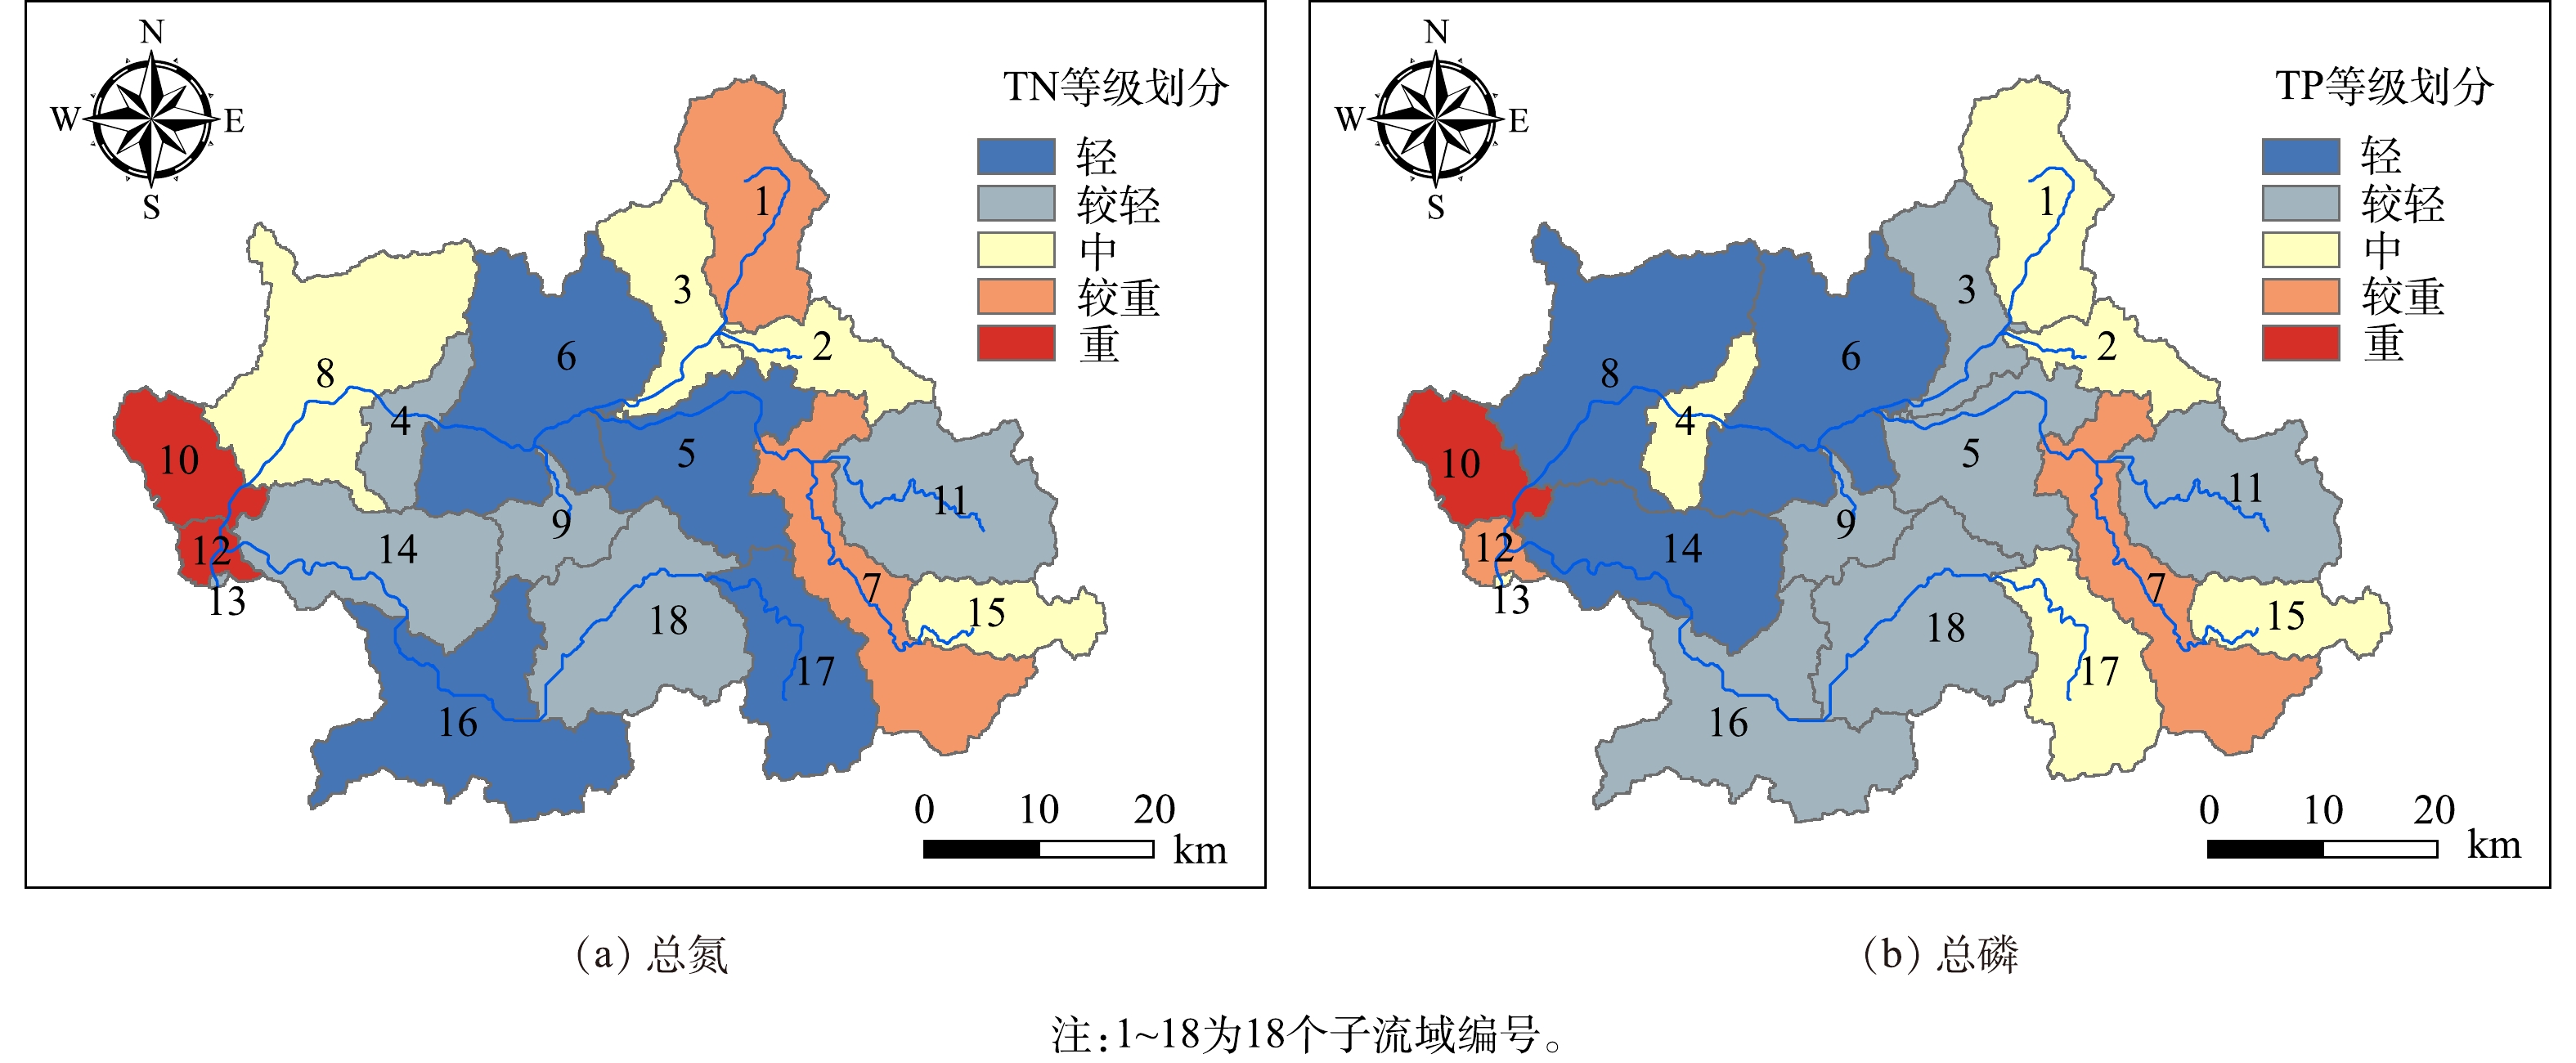
图 7 义乌江流域总氮和总磷流失强度分级
Figure 7. Classification of total nitrogen and total phosphorus loss intensity in Yiwu River Basin
Figure
7 ,Table
3 个