-

图 1 轧制周期示意图
Figure 1. Schematic diagram of rolling cycle
-

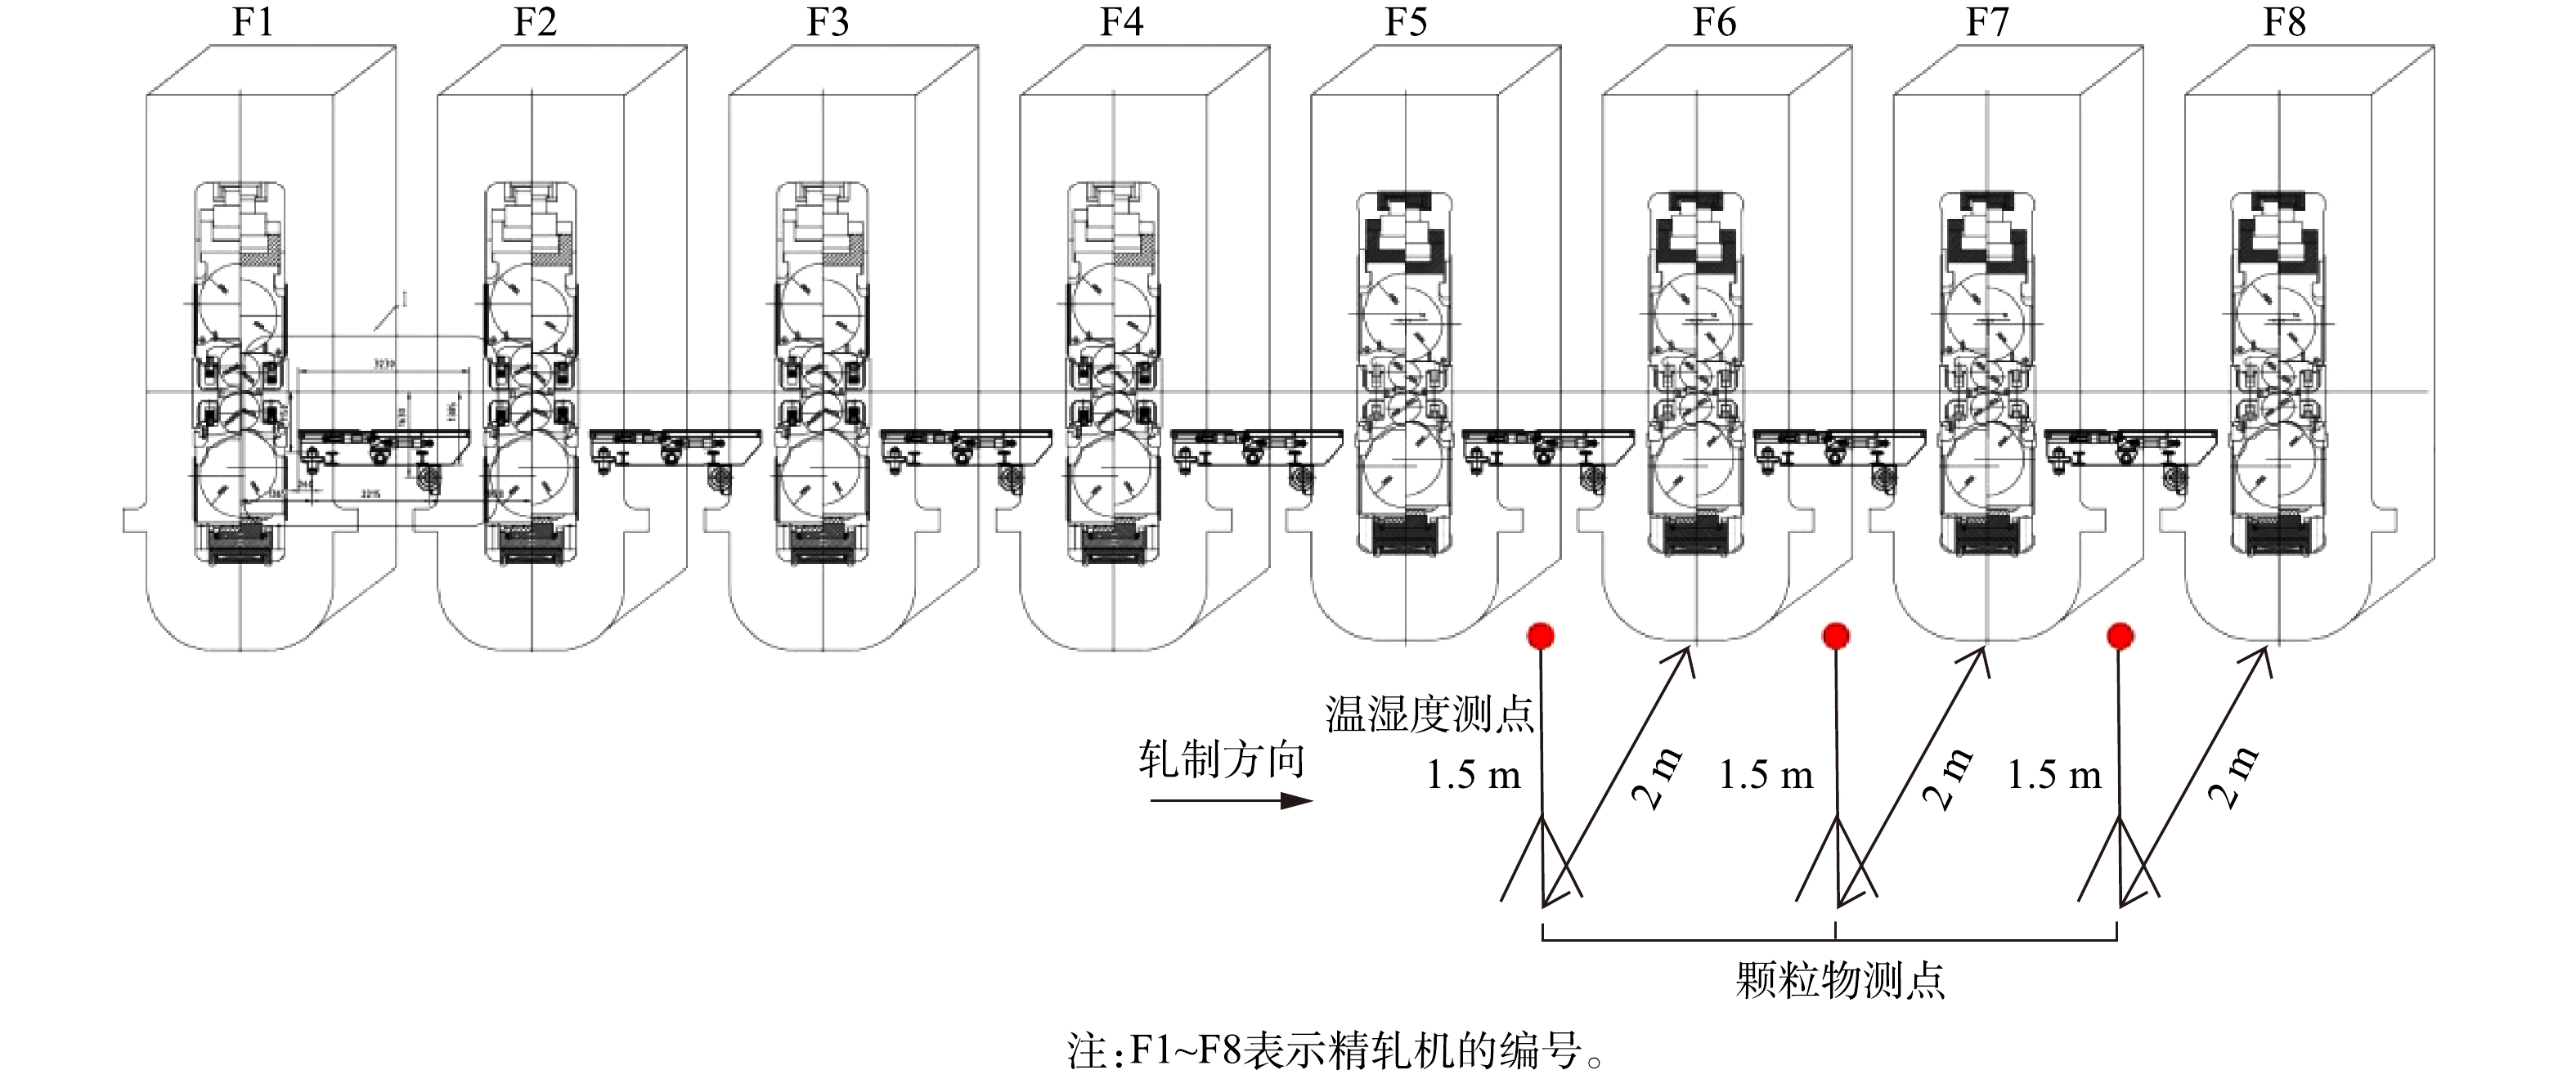
图 2 精轧工艺岗位环境测点布置示意图
Figure 2. Layout of environmental measuring points near finishing rolling process
-

图 3 污染源处颗粒物SEM图
Figure 3. SEM image of particles at pollution source
-

图 4 颗粒粒径分布的函数拟合与实测数据对比
Figure 4. Comparison of particle size distribution between function fitting and field measurement
-

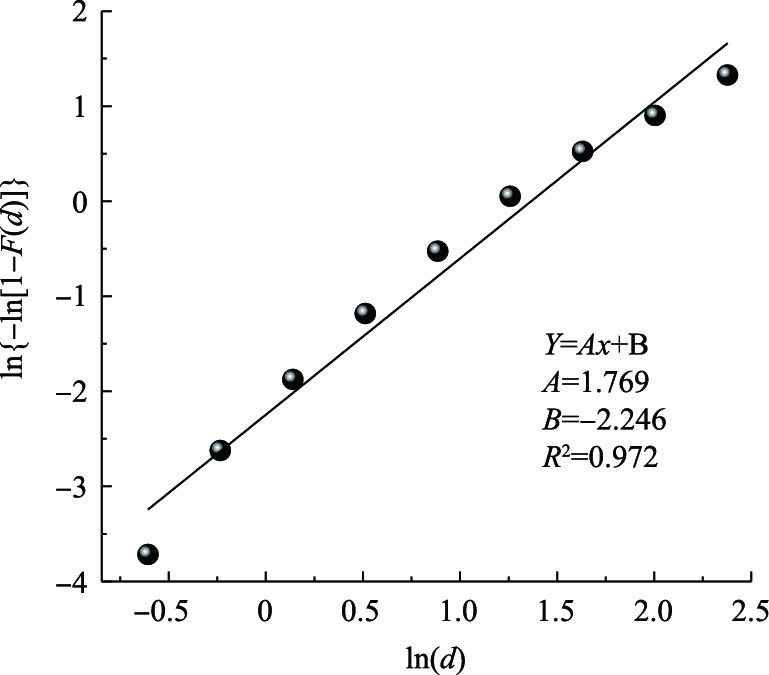
图 5 Rosin-Rammler分布函数拟合图
Figure 5. Fitting diagram of Rosin-Rammler distribution function
-

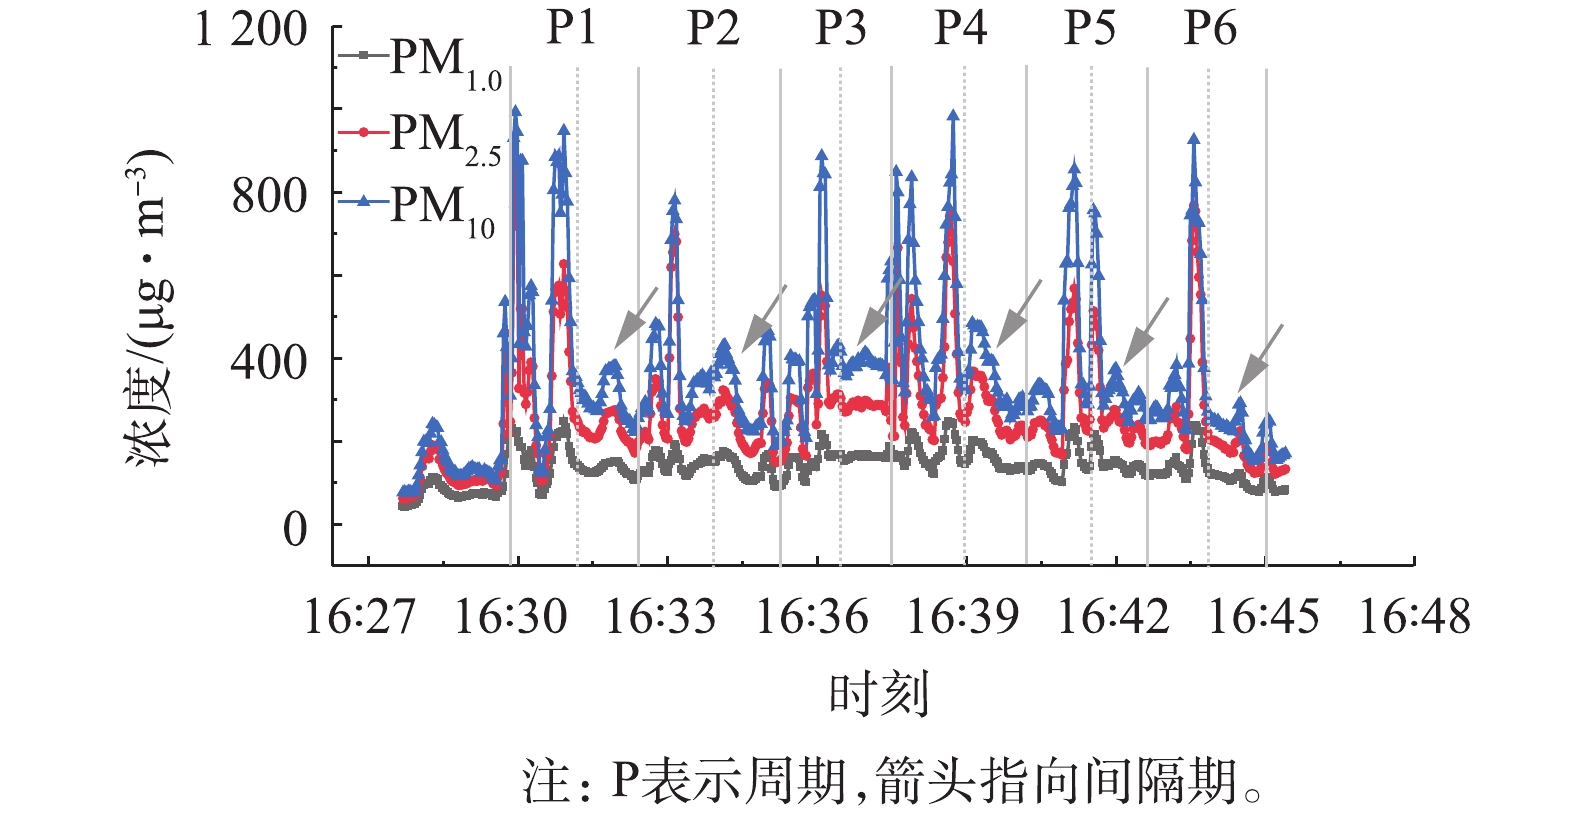
图 6 单架精轧机6个周期PM1.0、PM2.5和PM10浓度变化规律
Figure 6. Concentration variation of PM1.0, PM2.5 and PM10 within 6 cycles of single finishing mill
-

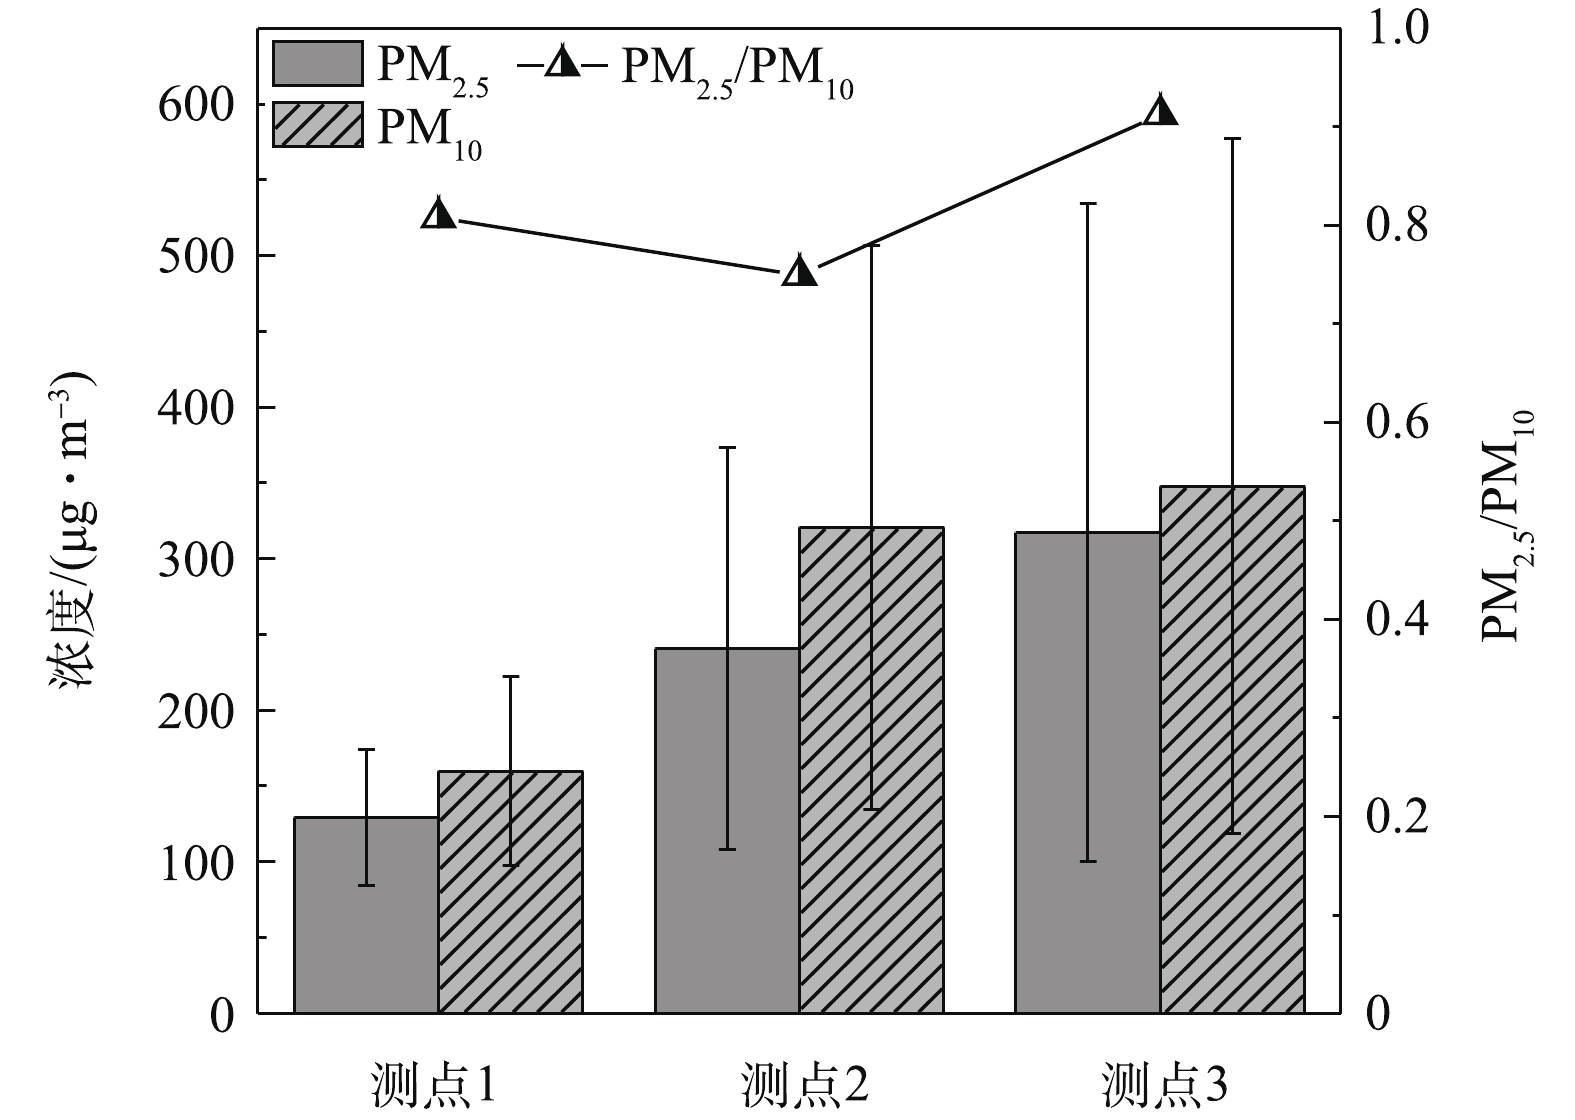
图 7 精轧工艺岗位环境测点PM2.5、PM10浓度空间分布
Figure 7. Spatial distribution of PM2.5 and PM10 concentration in the occupied zone
Figure
7 ,Table
1 个