-
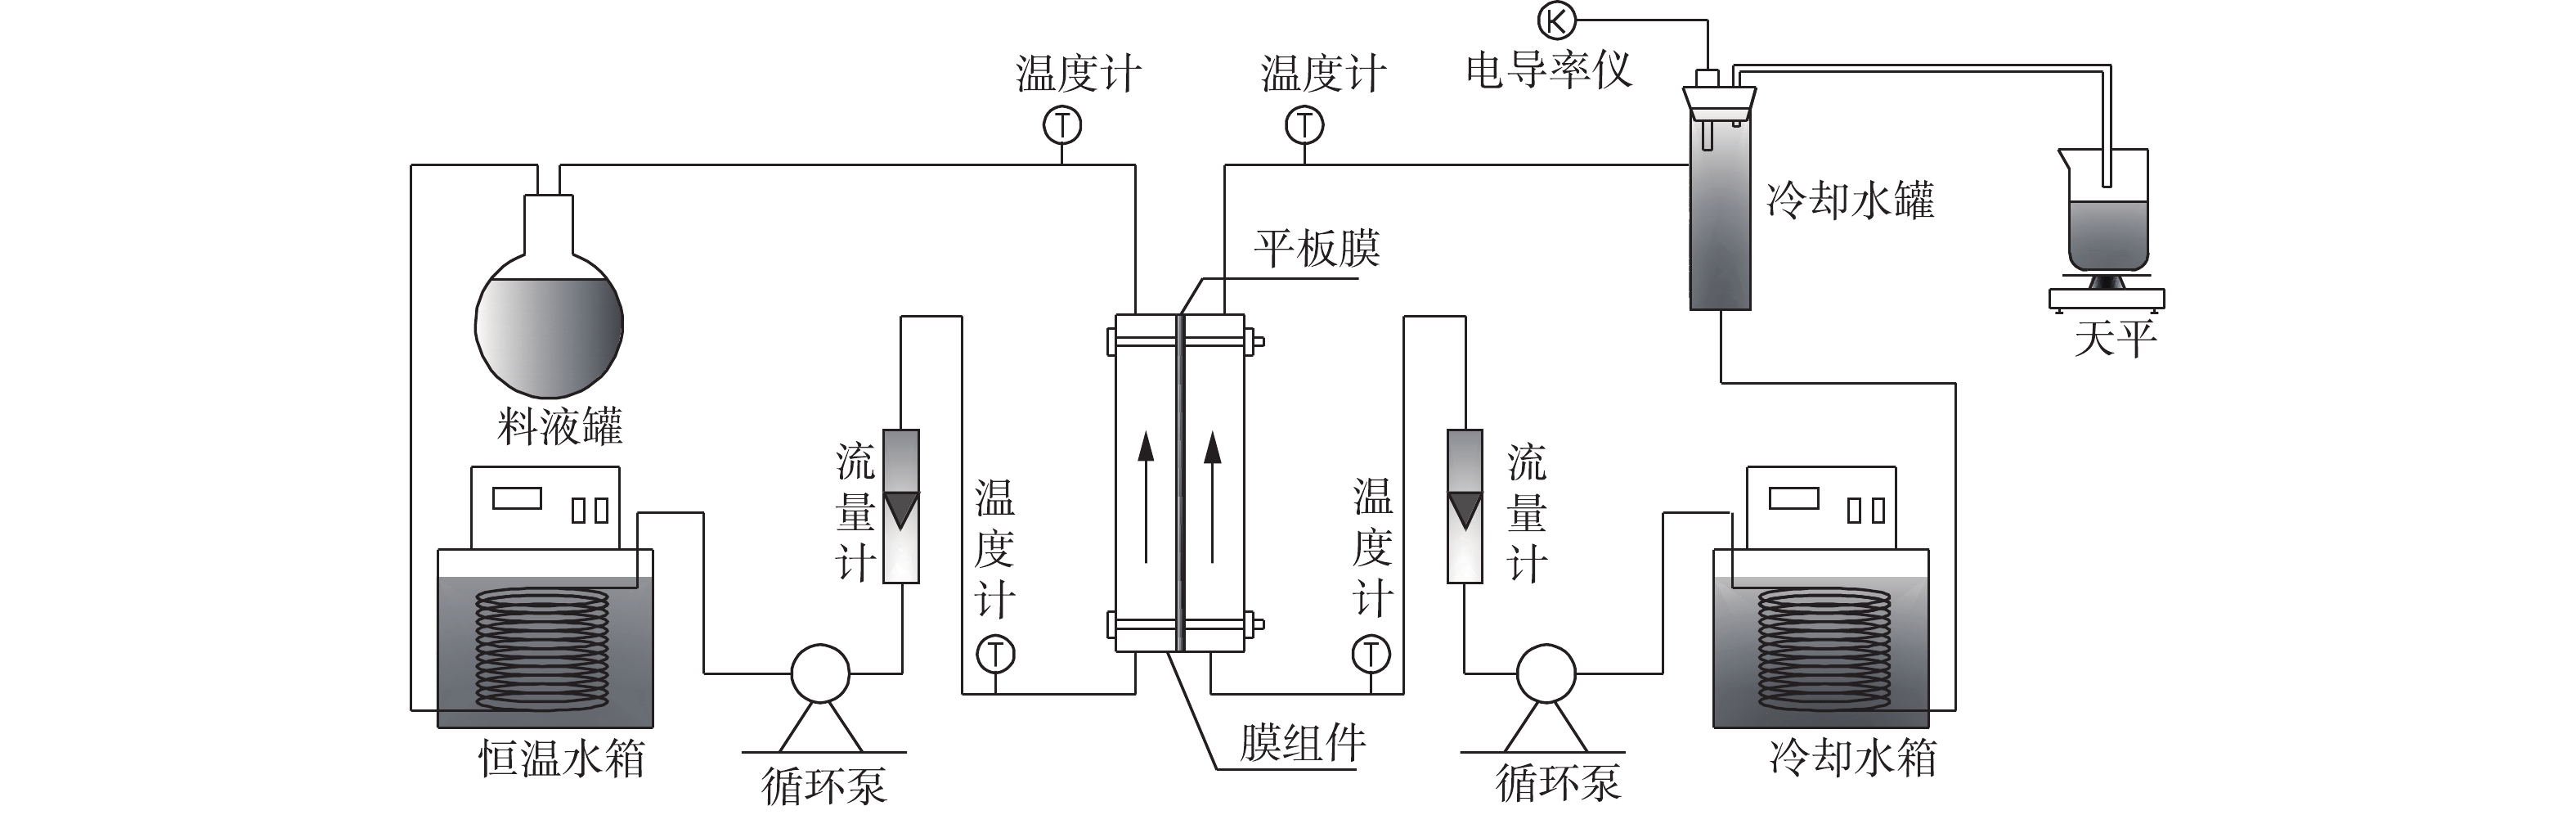
图 1 直接接触式膜蒸馏工艺流程
Figure 1. Schematic diagram of the experimental DCMD set-up
-
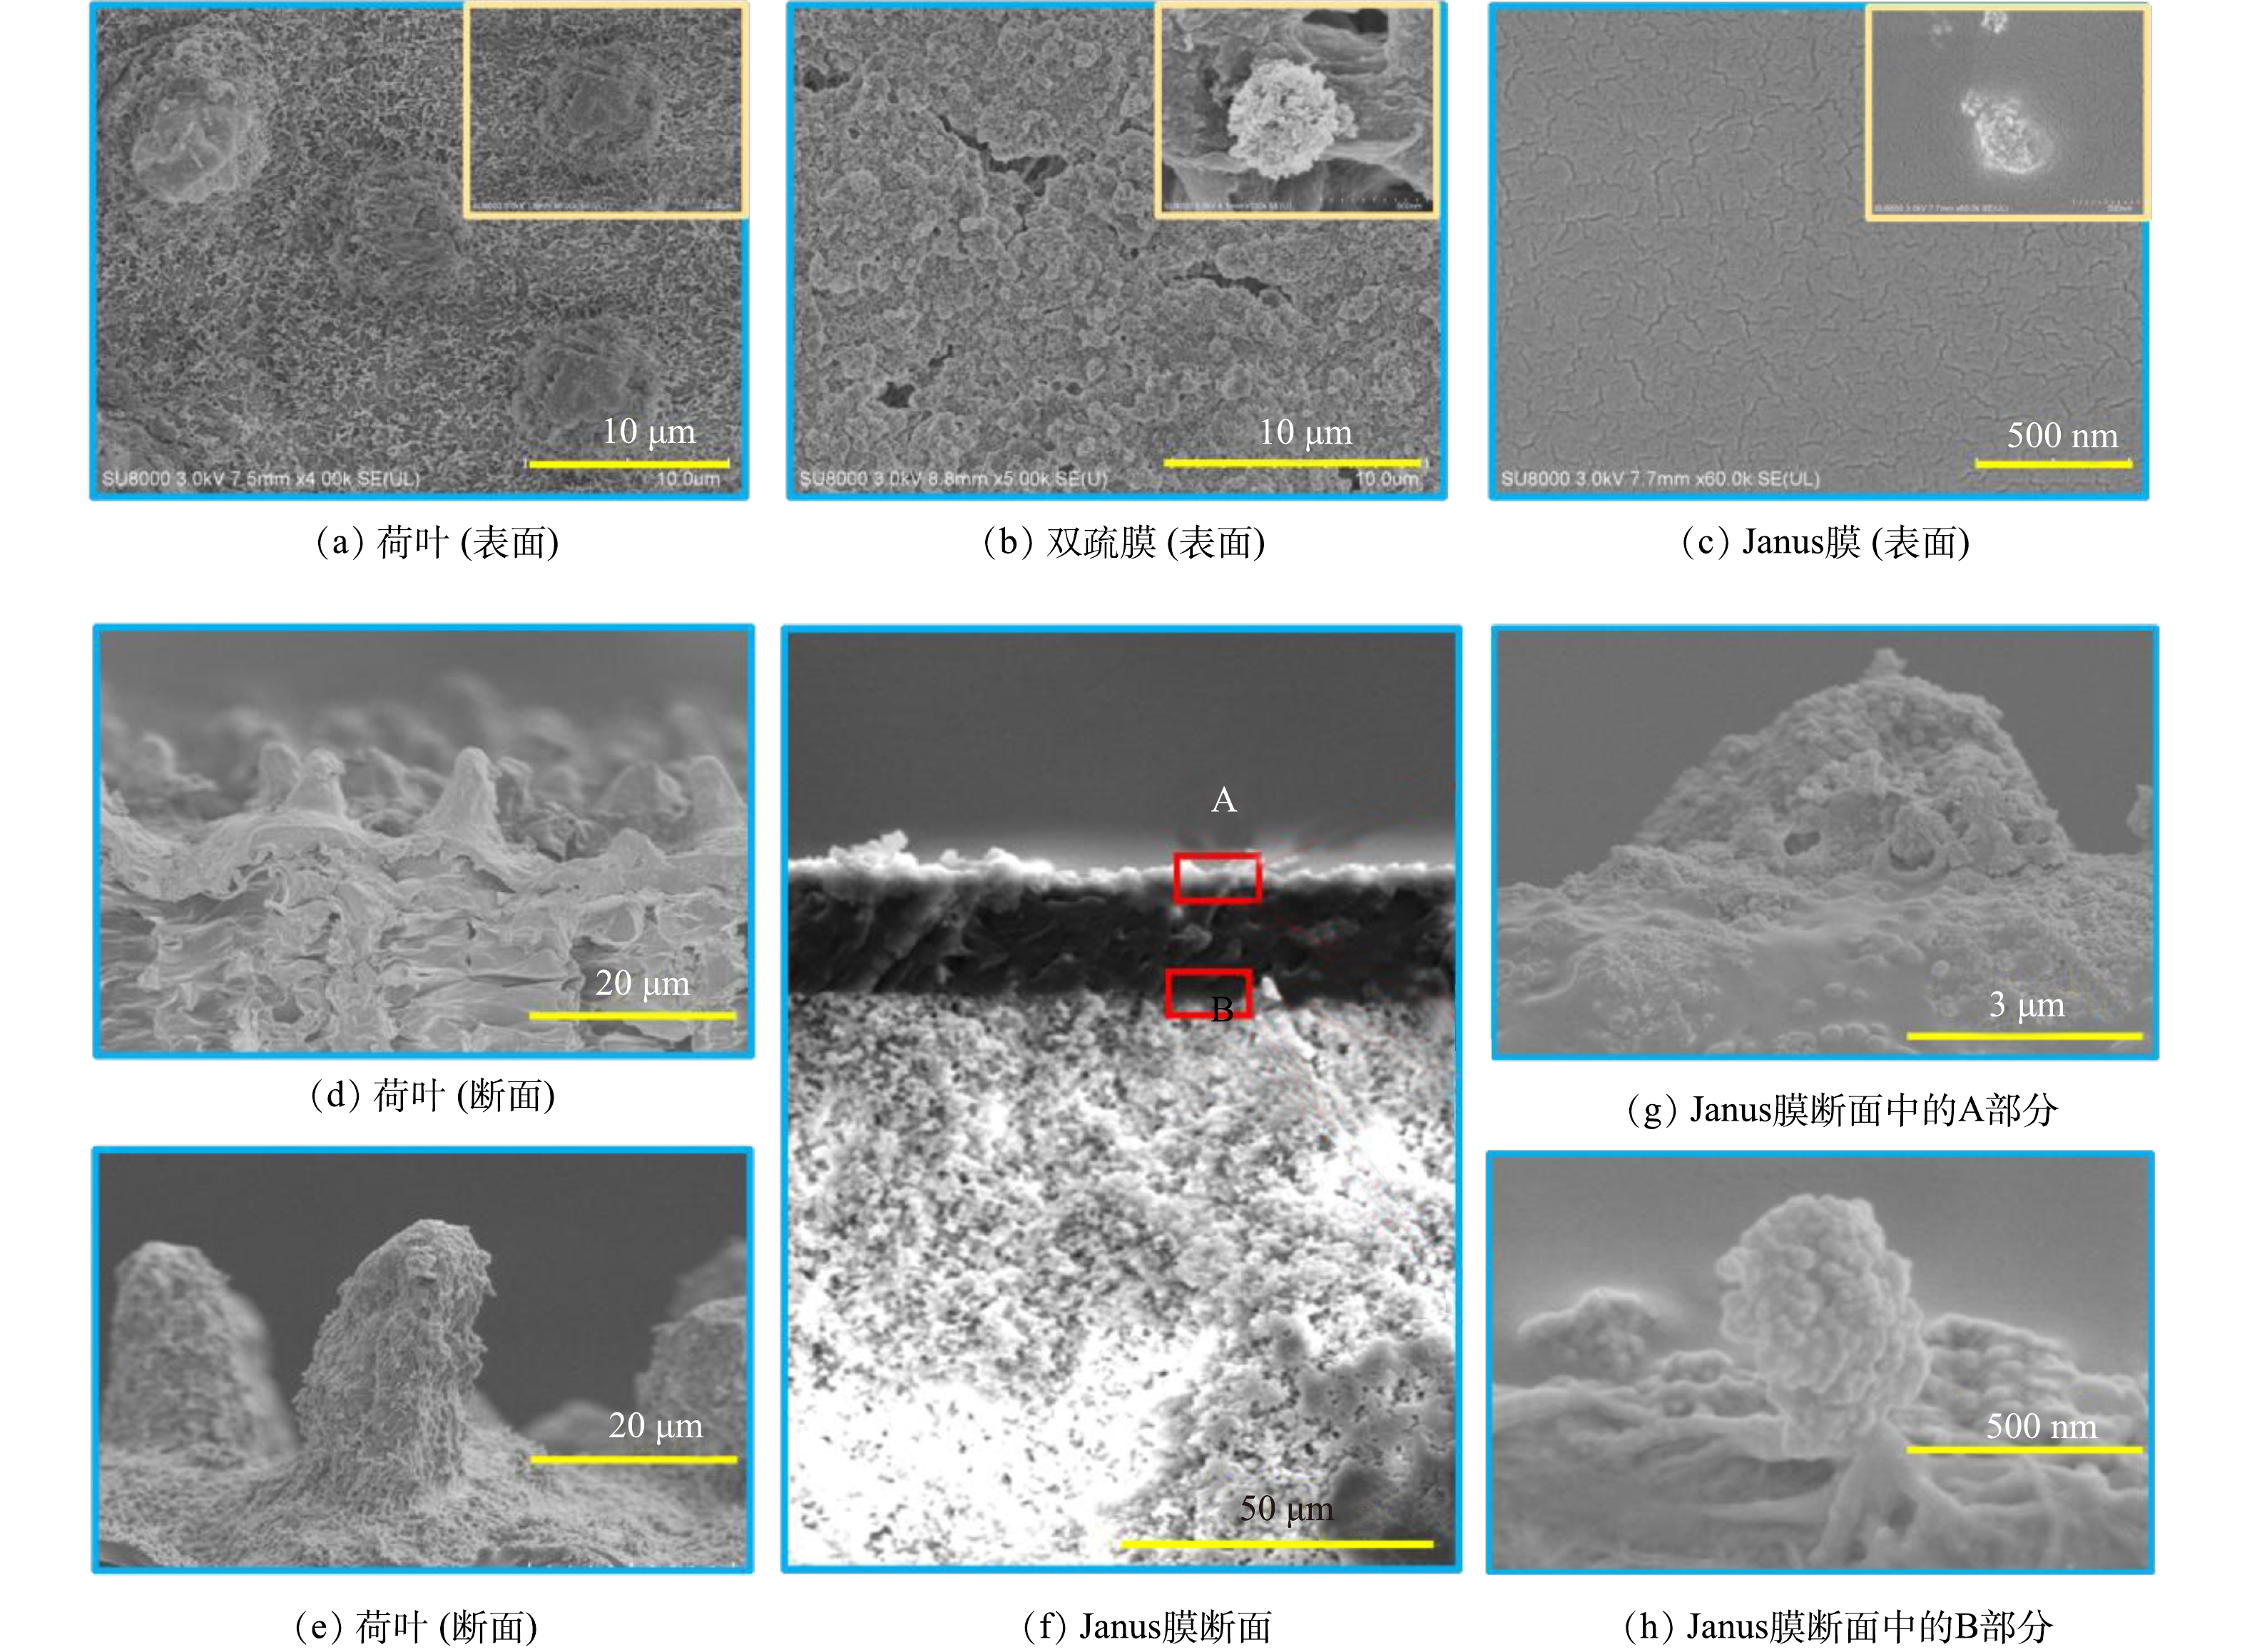
图 2 膜表面及断面SEM图
Figure 2. SEM images of membrane samples
-
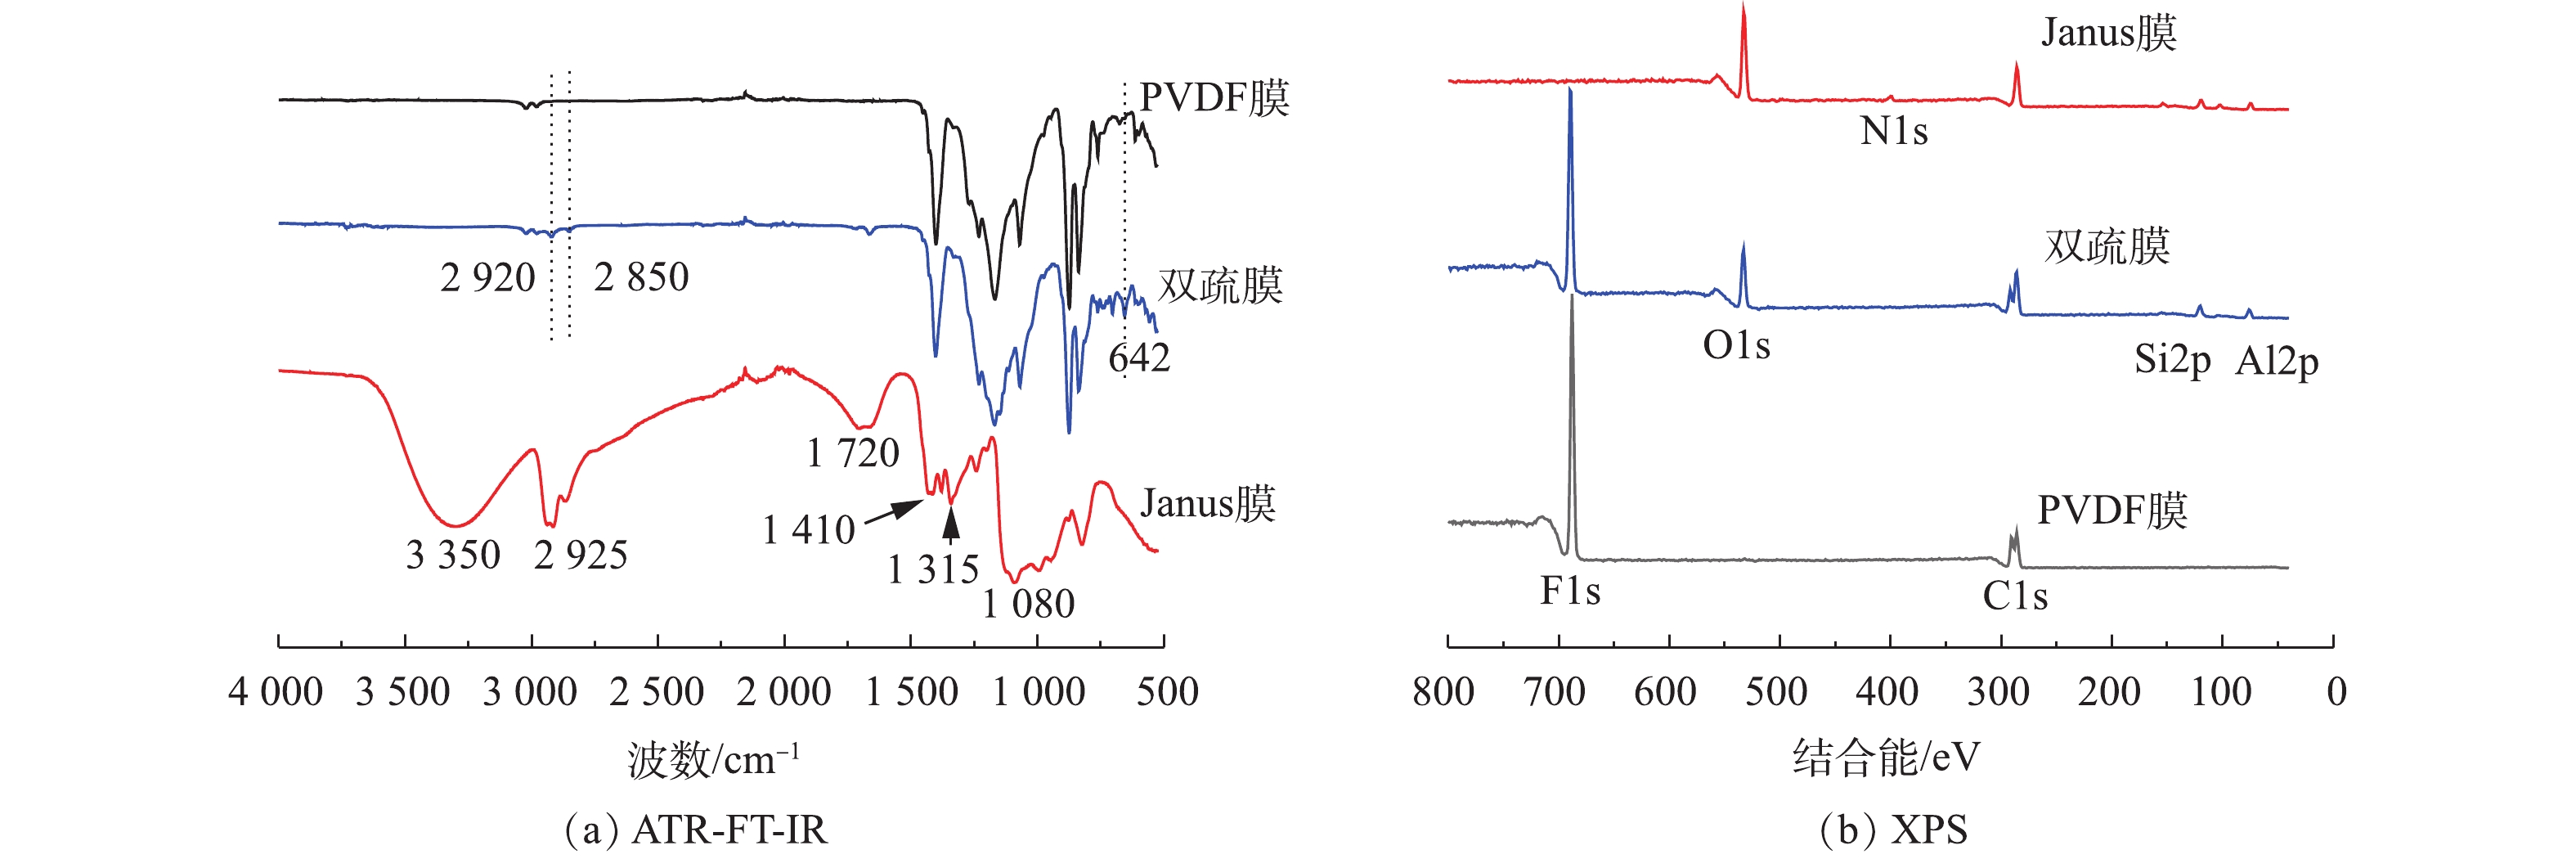
图 3 膜表面化学成分分析
Figure 3. Spectra of membrane surface chemical composition
-
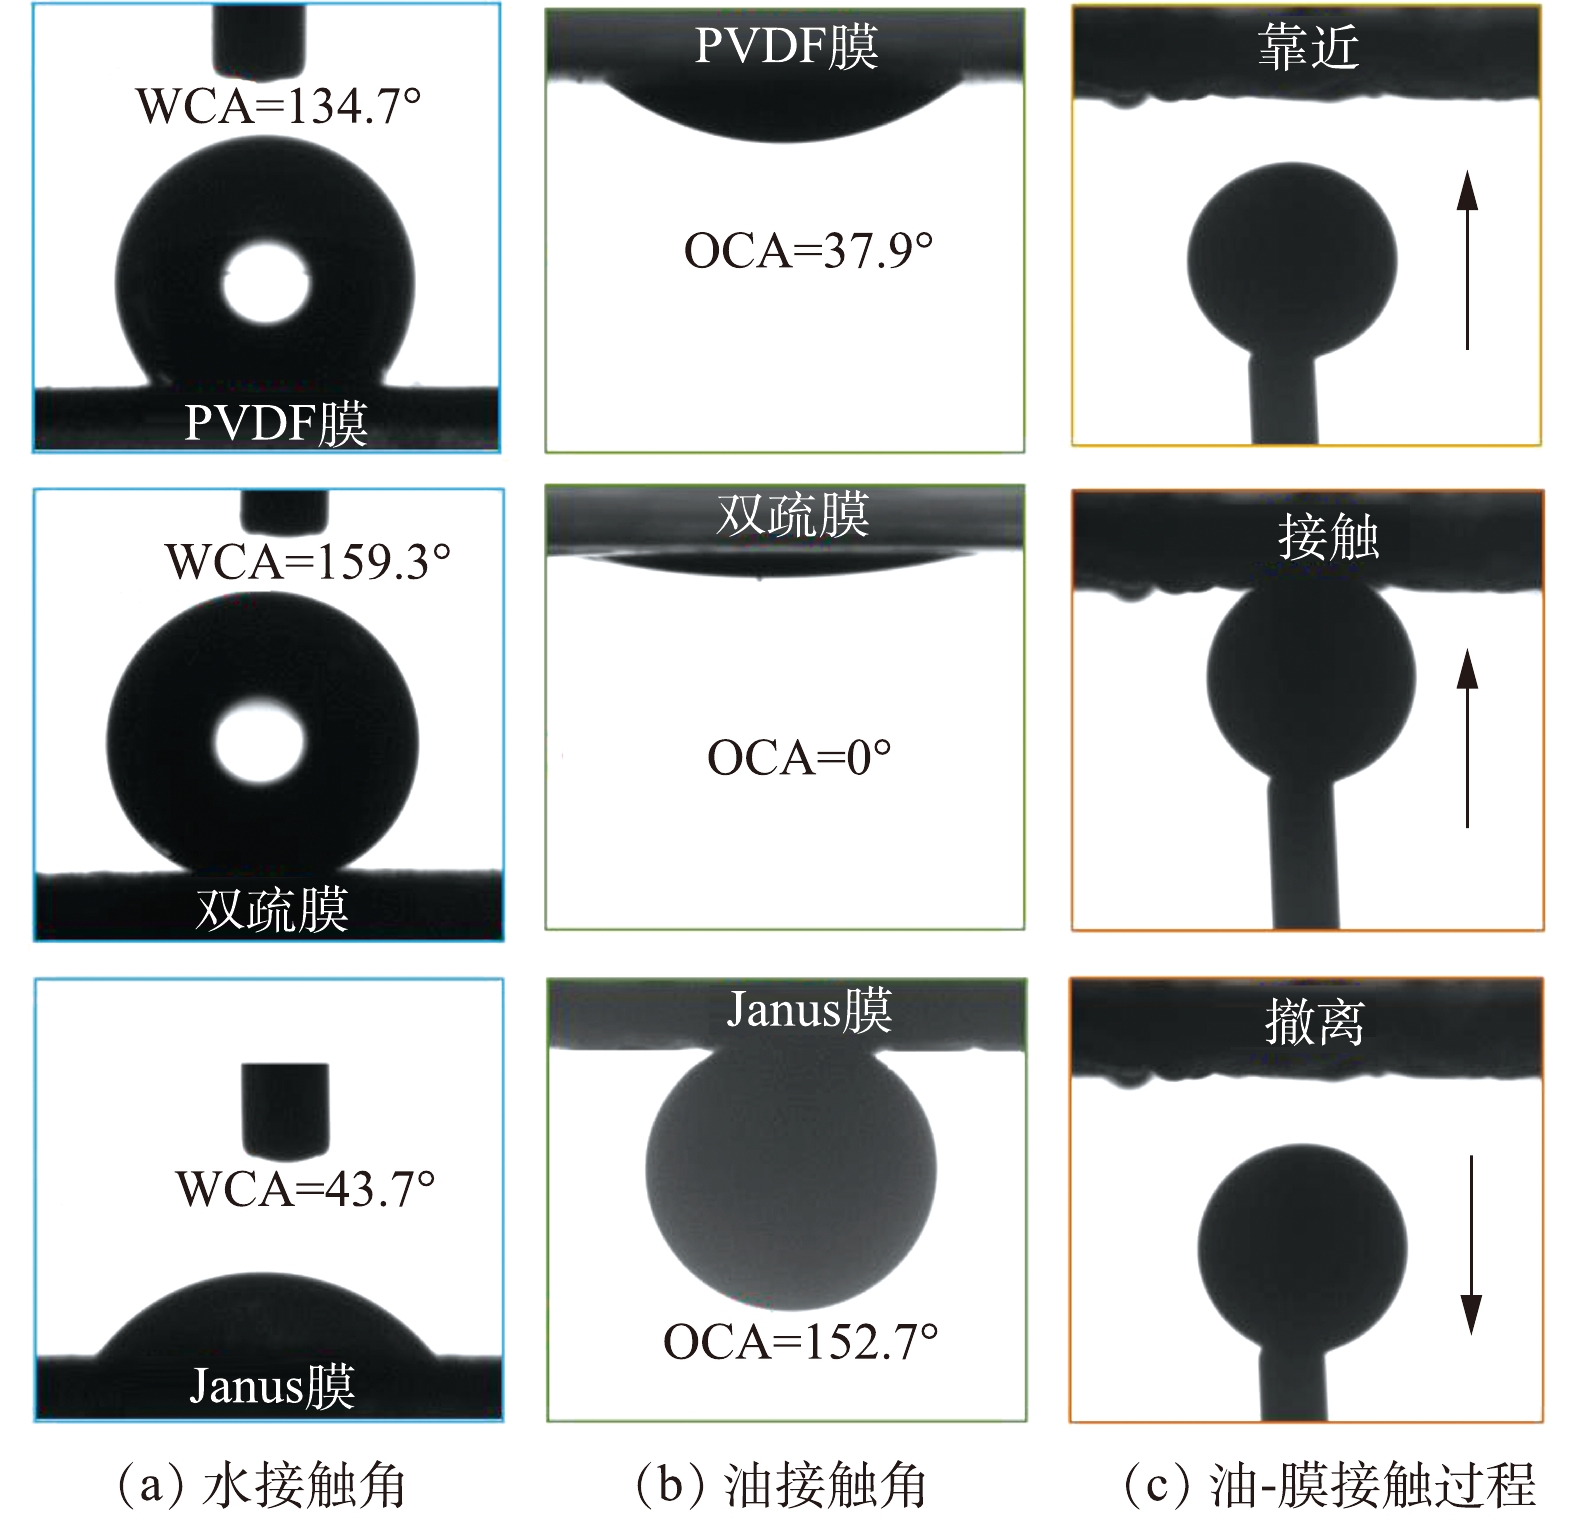
图 4 膜表面润湿性
Figure 4. Membrane surface wettability
-

图 5 不同油类在Janus膜表面的水下油接触角
Figure 5. Underwater OCAs of different oil-droplets on Janus membrane surfaces
-

图 6 膜孔径分布
Figure 6. Membrane pore size structural
-
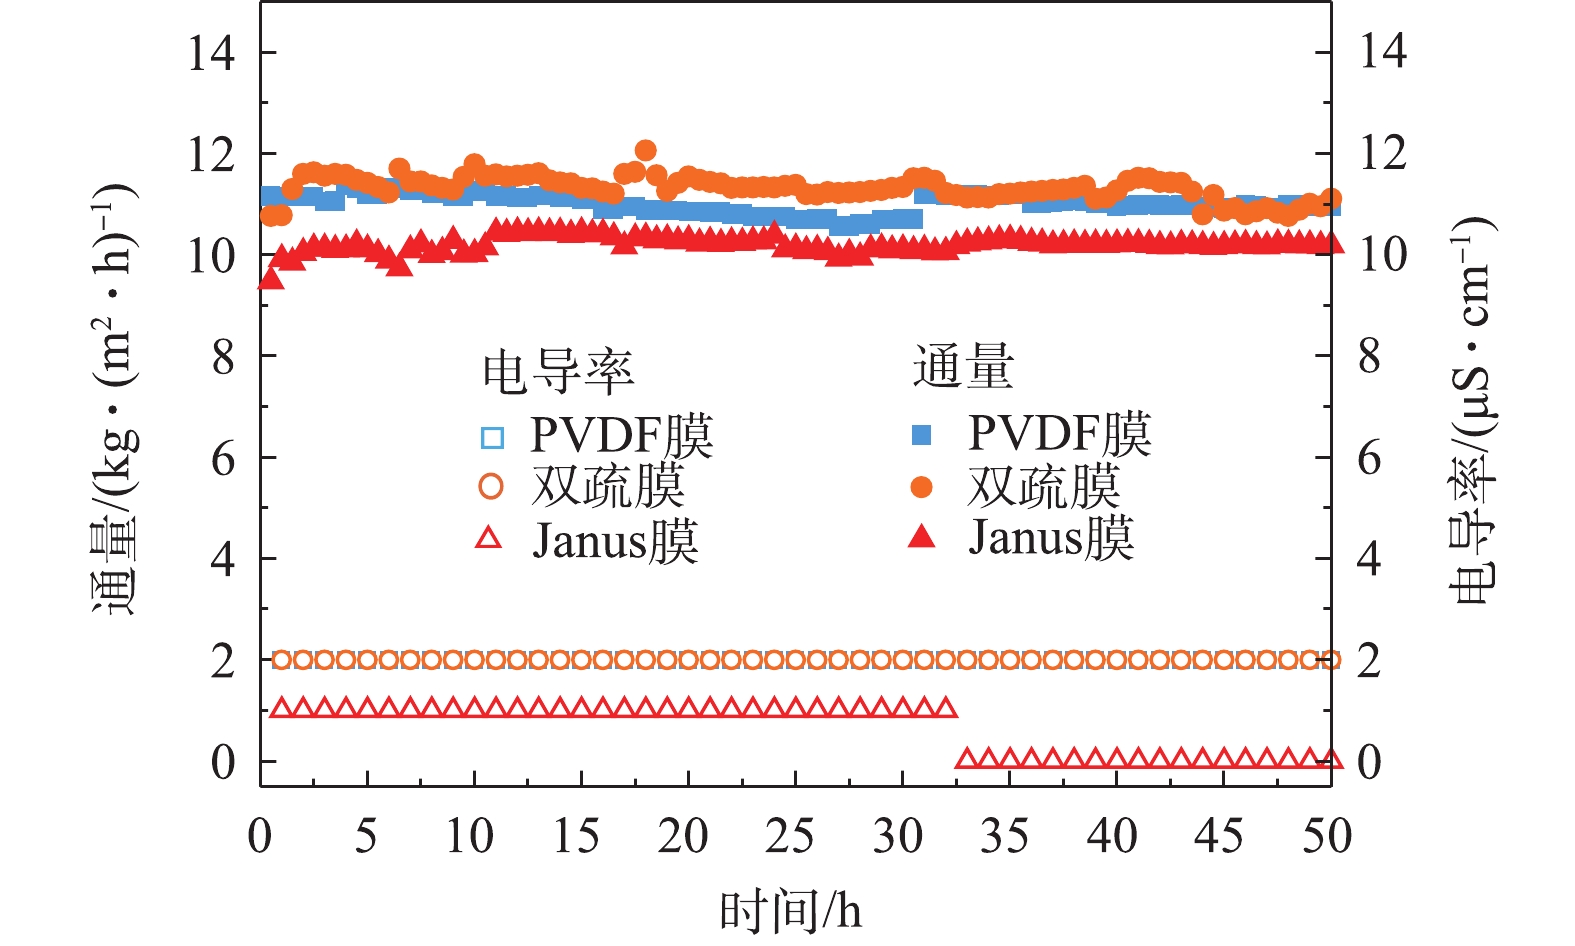
图 7 DCMD通量和电导率随时间的变化
Figure 7. Variation of permeate flux and conductivity with operation time
-
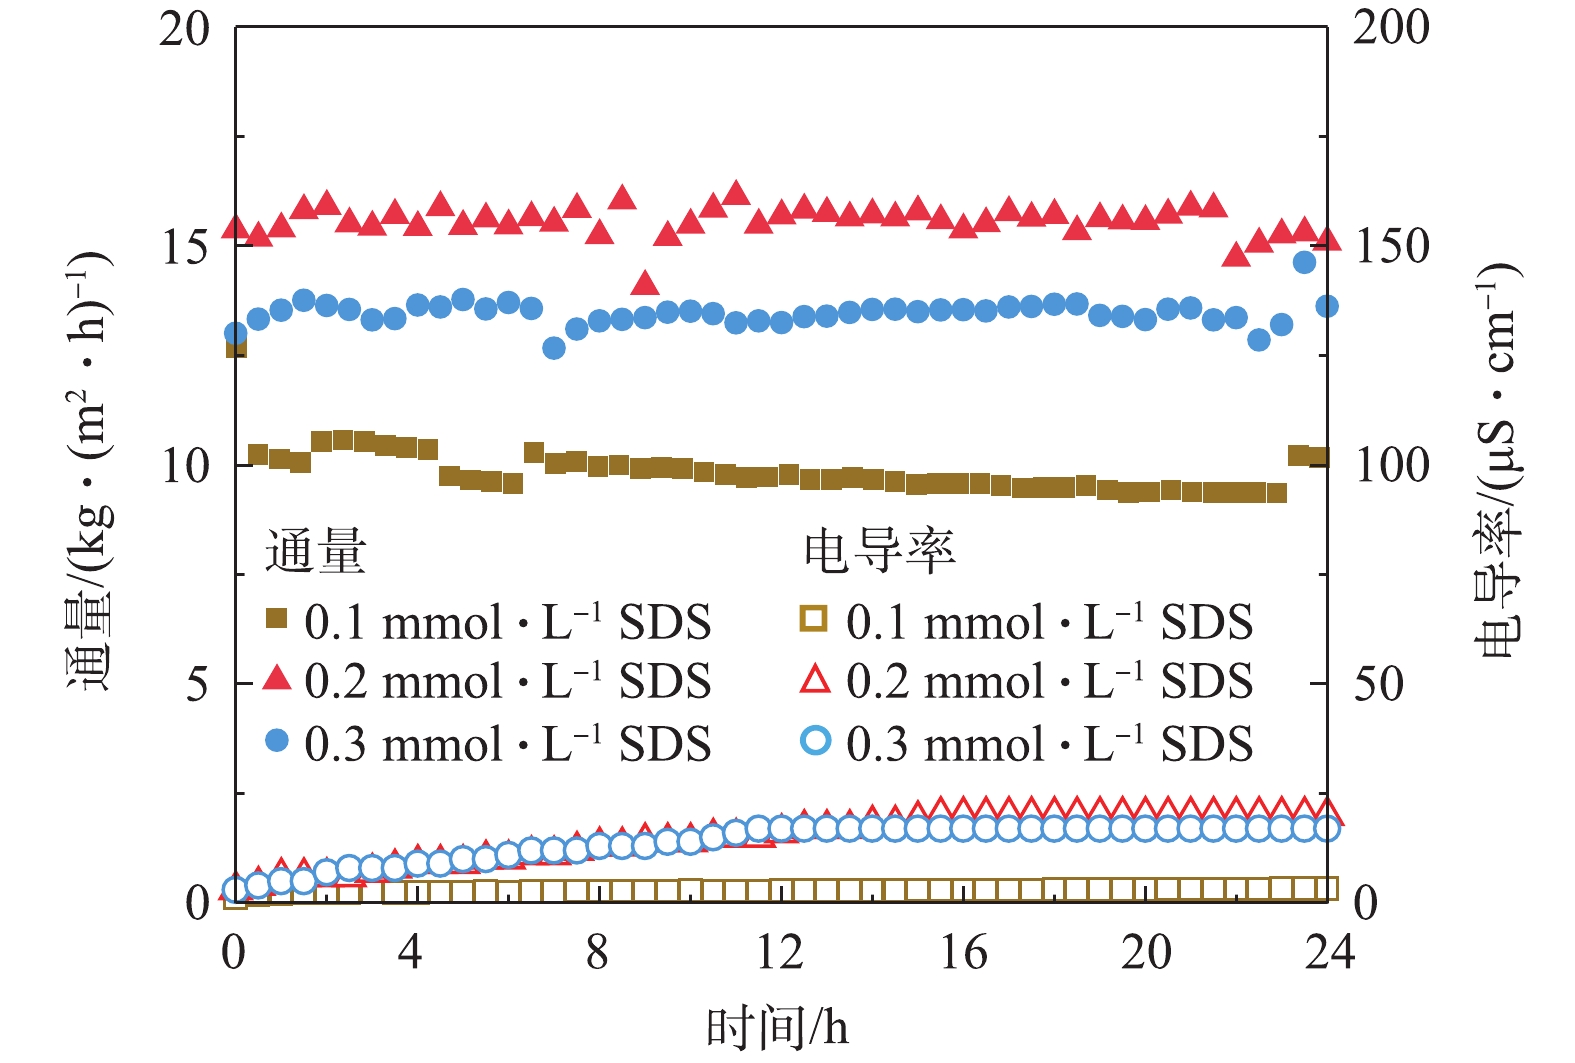
图 8 Janus膜通量和电导率随时间变化
Figure 8. Variation of permeate flux and conductivity of the Janus membrane with operation time
-

图 9 DCMD通量及电导率随时间的变化
Figure 9. Variation of permeate flux and conductivity of the Janus membrane with operation time
-

图 10 油-膜作用力定量表征
Figure 10. Oil-membrane adhesion force spectrum
Figure
10 ,Table
1 个