-
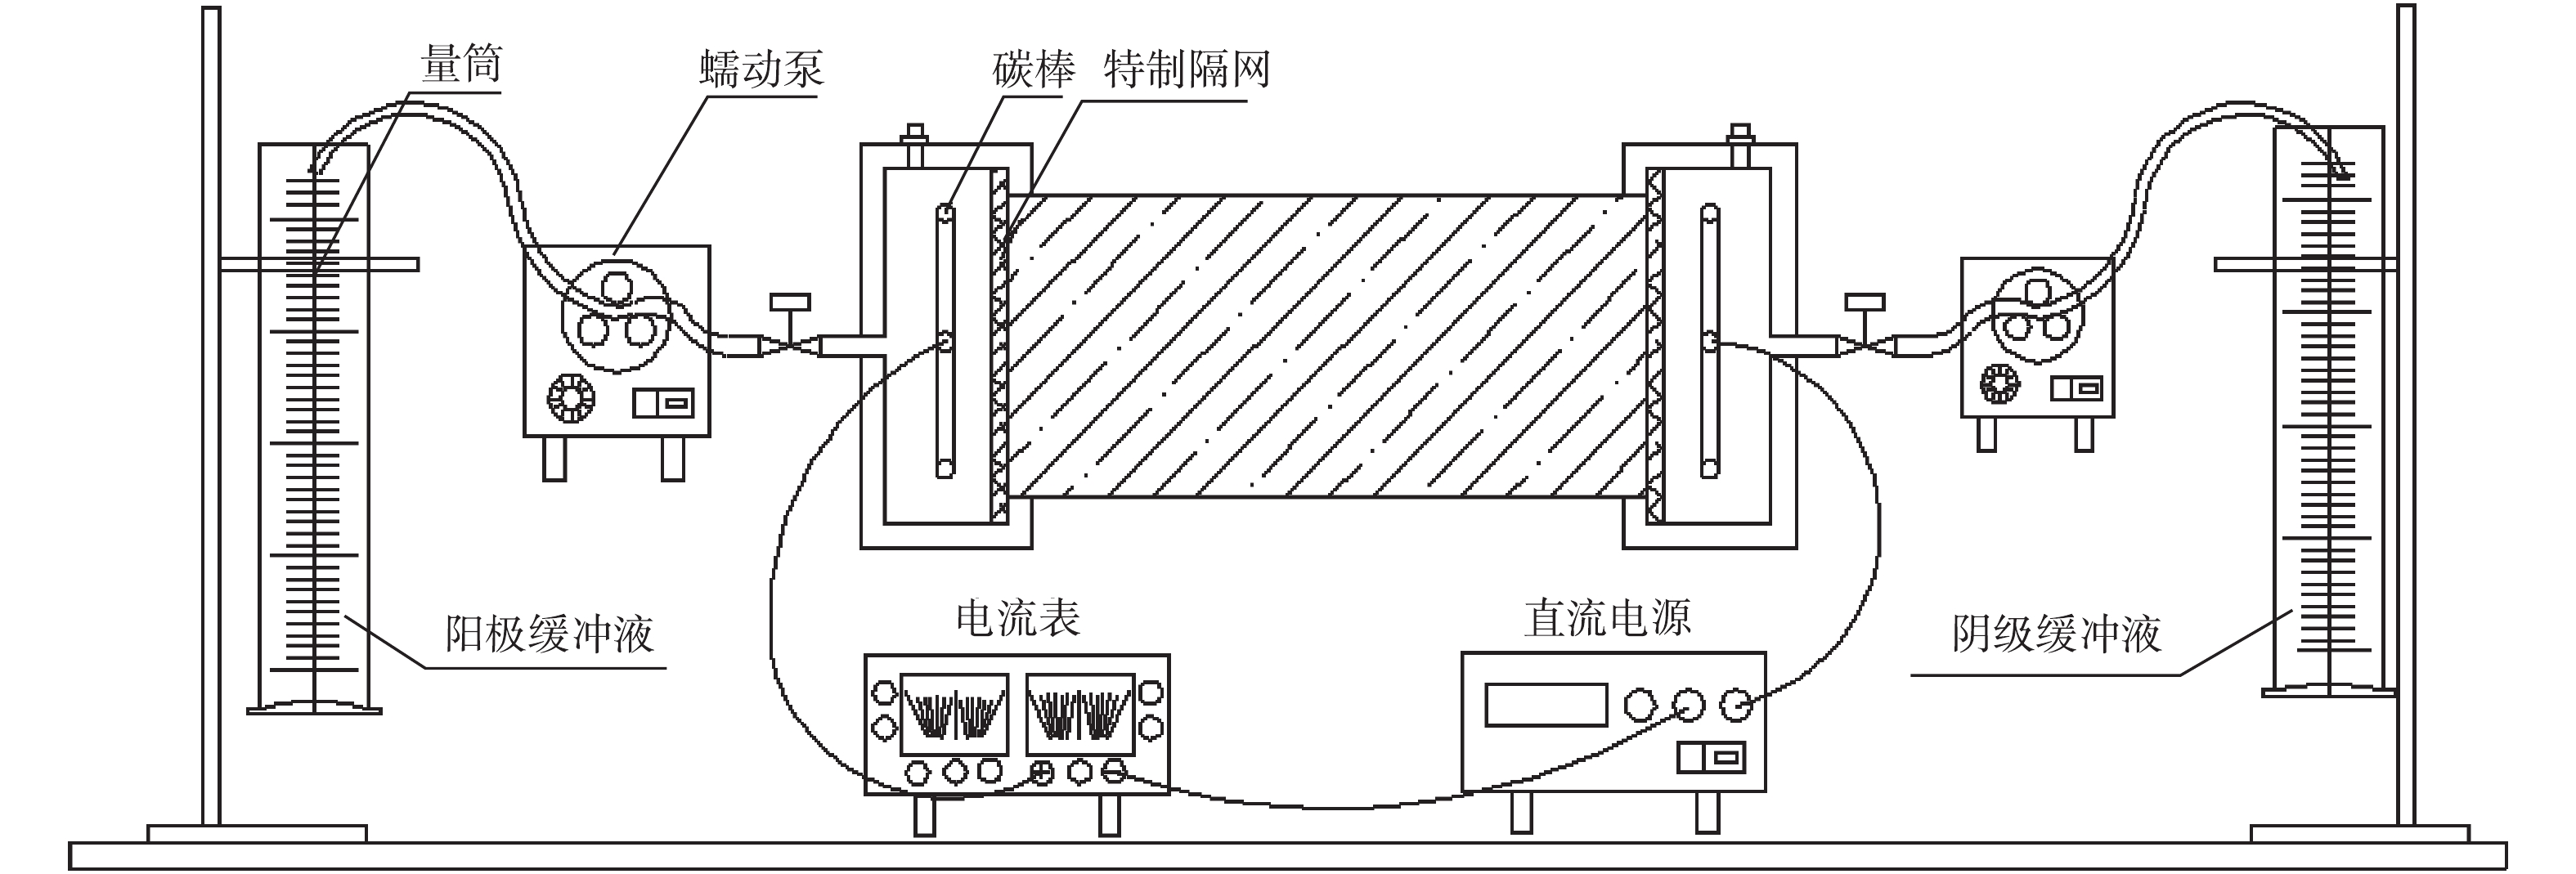
图 1 电动力学实验装置
Figure 1. Schematic diagram of electrokinetic experimental device
-
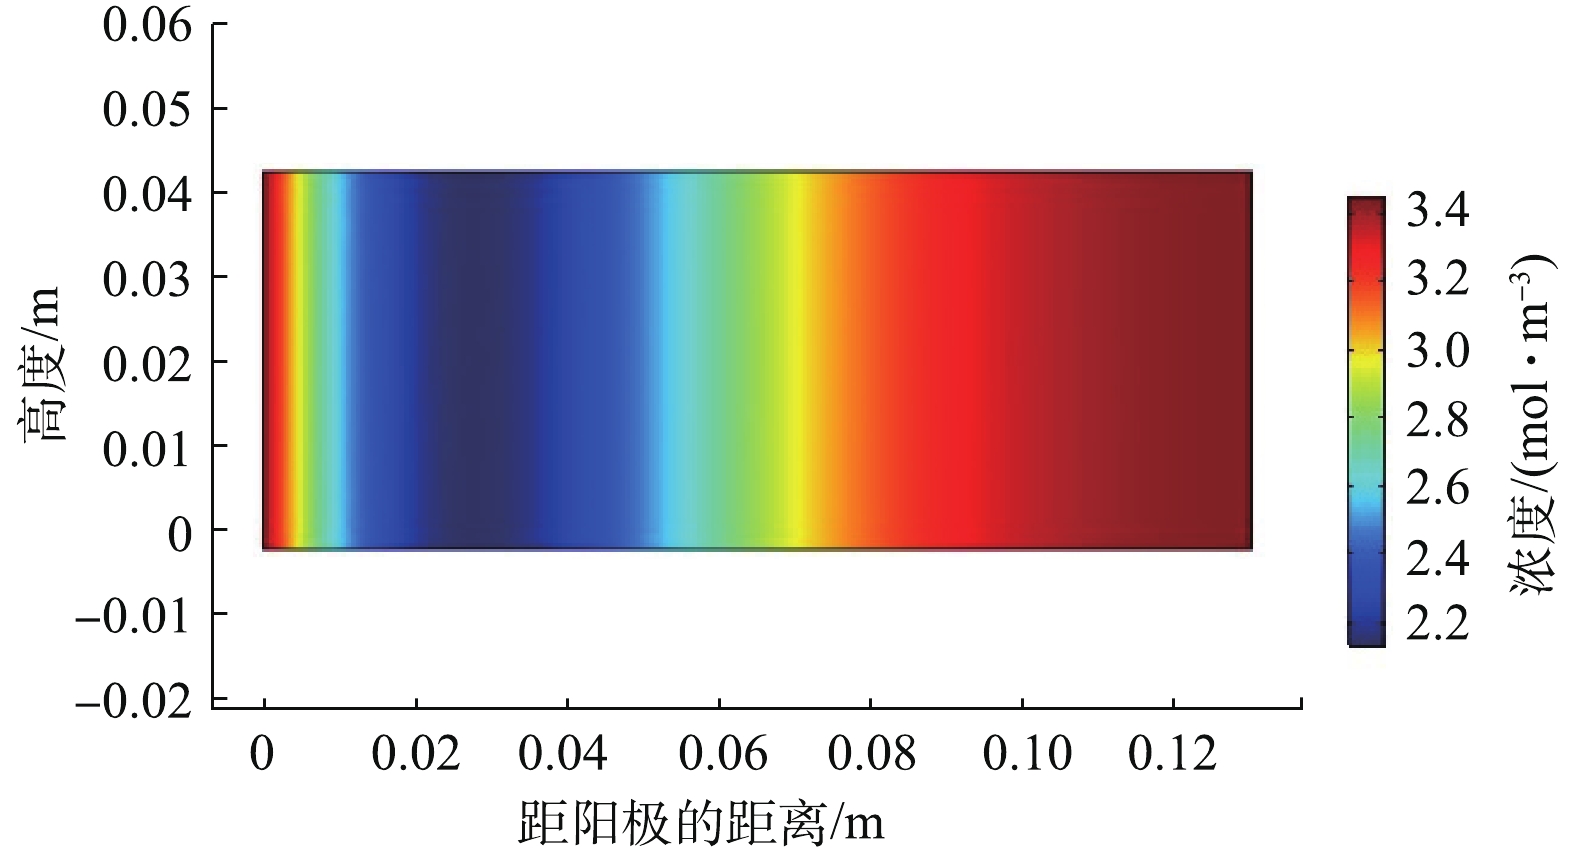
图 2 电动实验结束后菲的浓度分布
Figure 2. Concentration distribution of phenanthrene after the end of the electric experiment
-
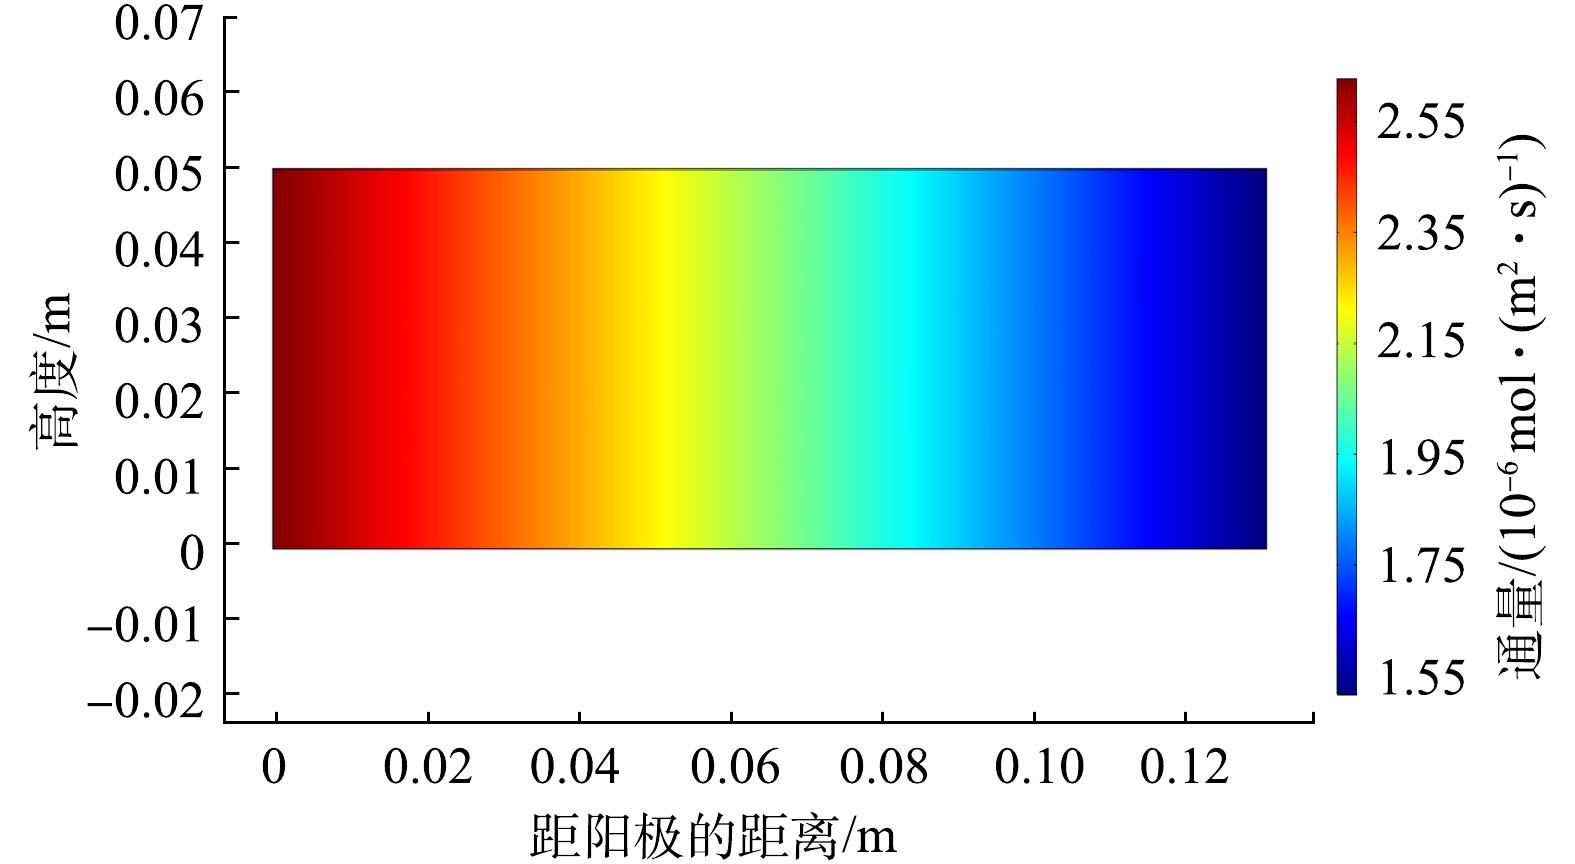
图 3 总通量x方向通量
Figure 3. Flux in x direction for the total flux
-
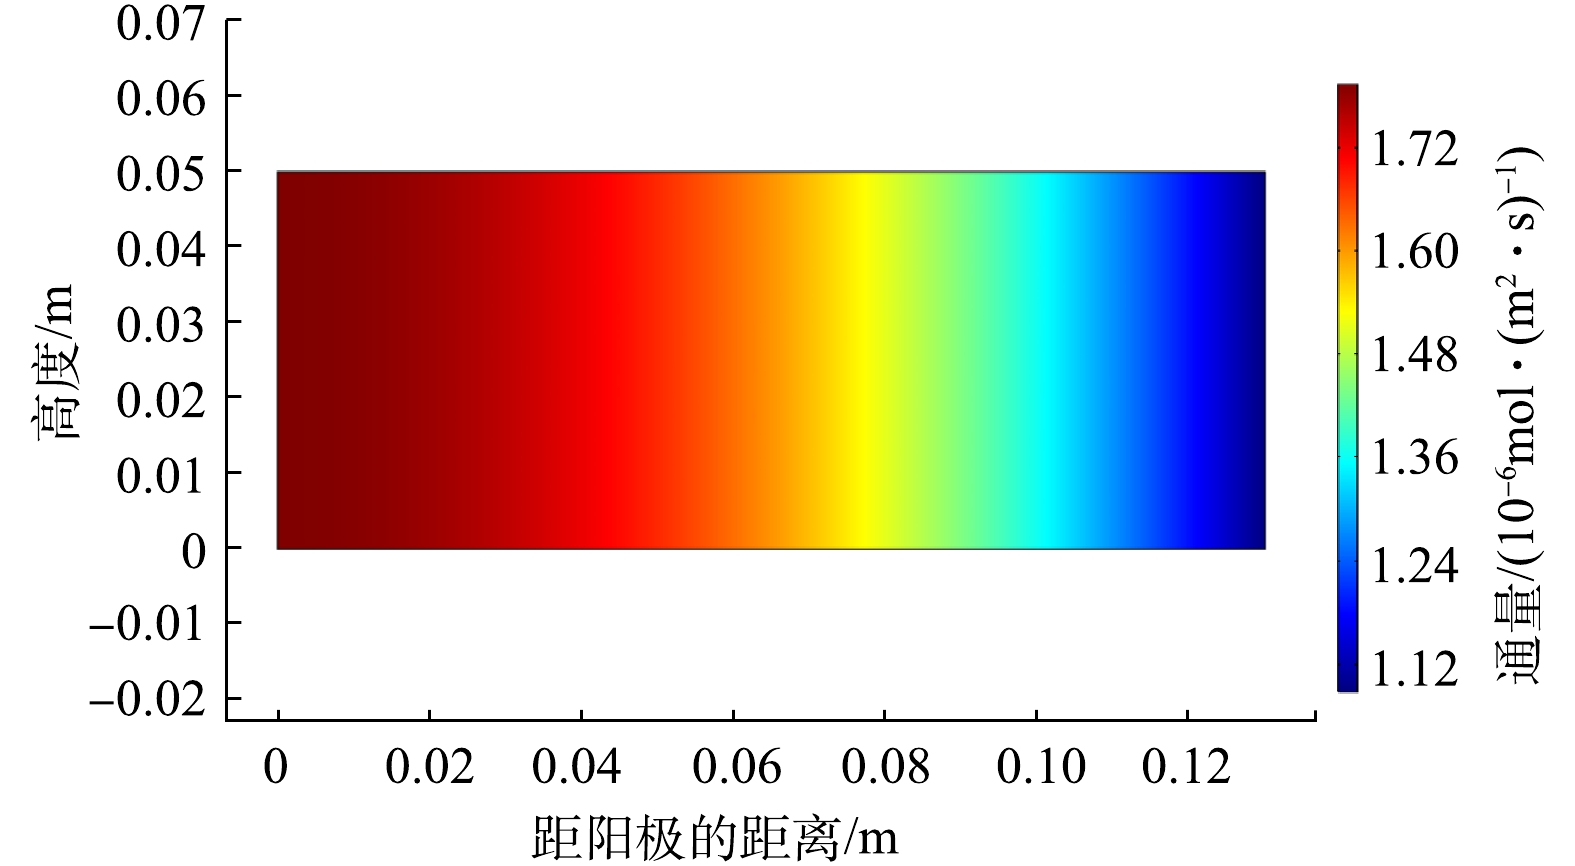
图 4 电渗流x方向分量
Figure 4. Component in x direction for electroosmotic flow
-

图 5 土壤区域划分图
Figure 5. Division of the soil area
-
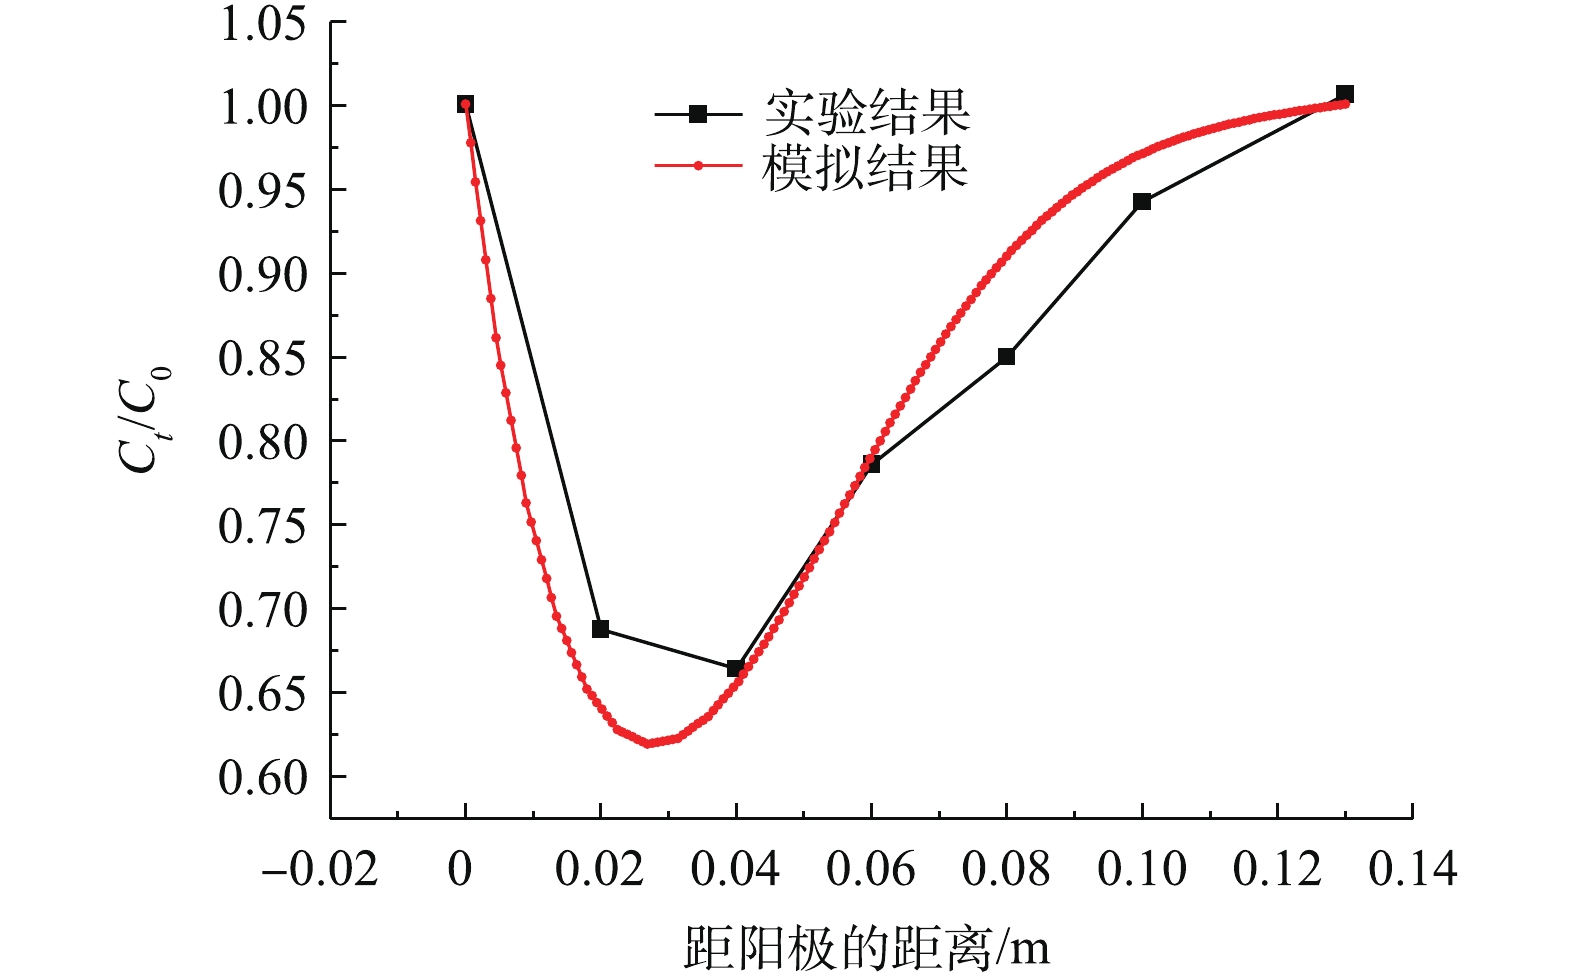
图 6 t=108 h菲的分布
Figure 6. Phenanthrene distribution at t=108 h
-
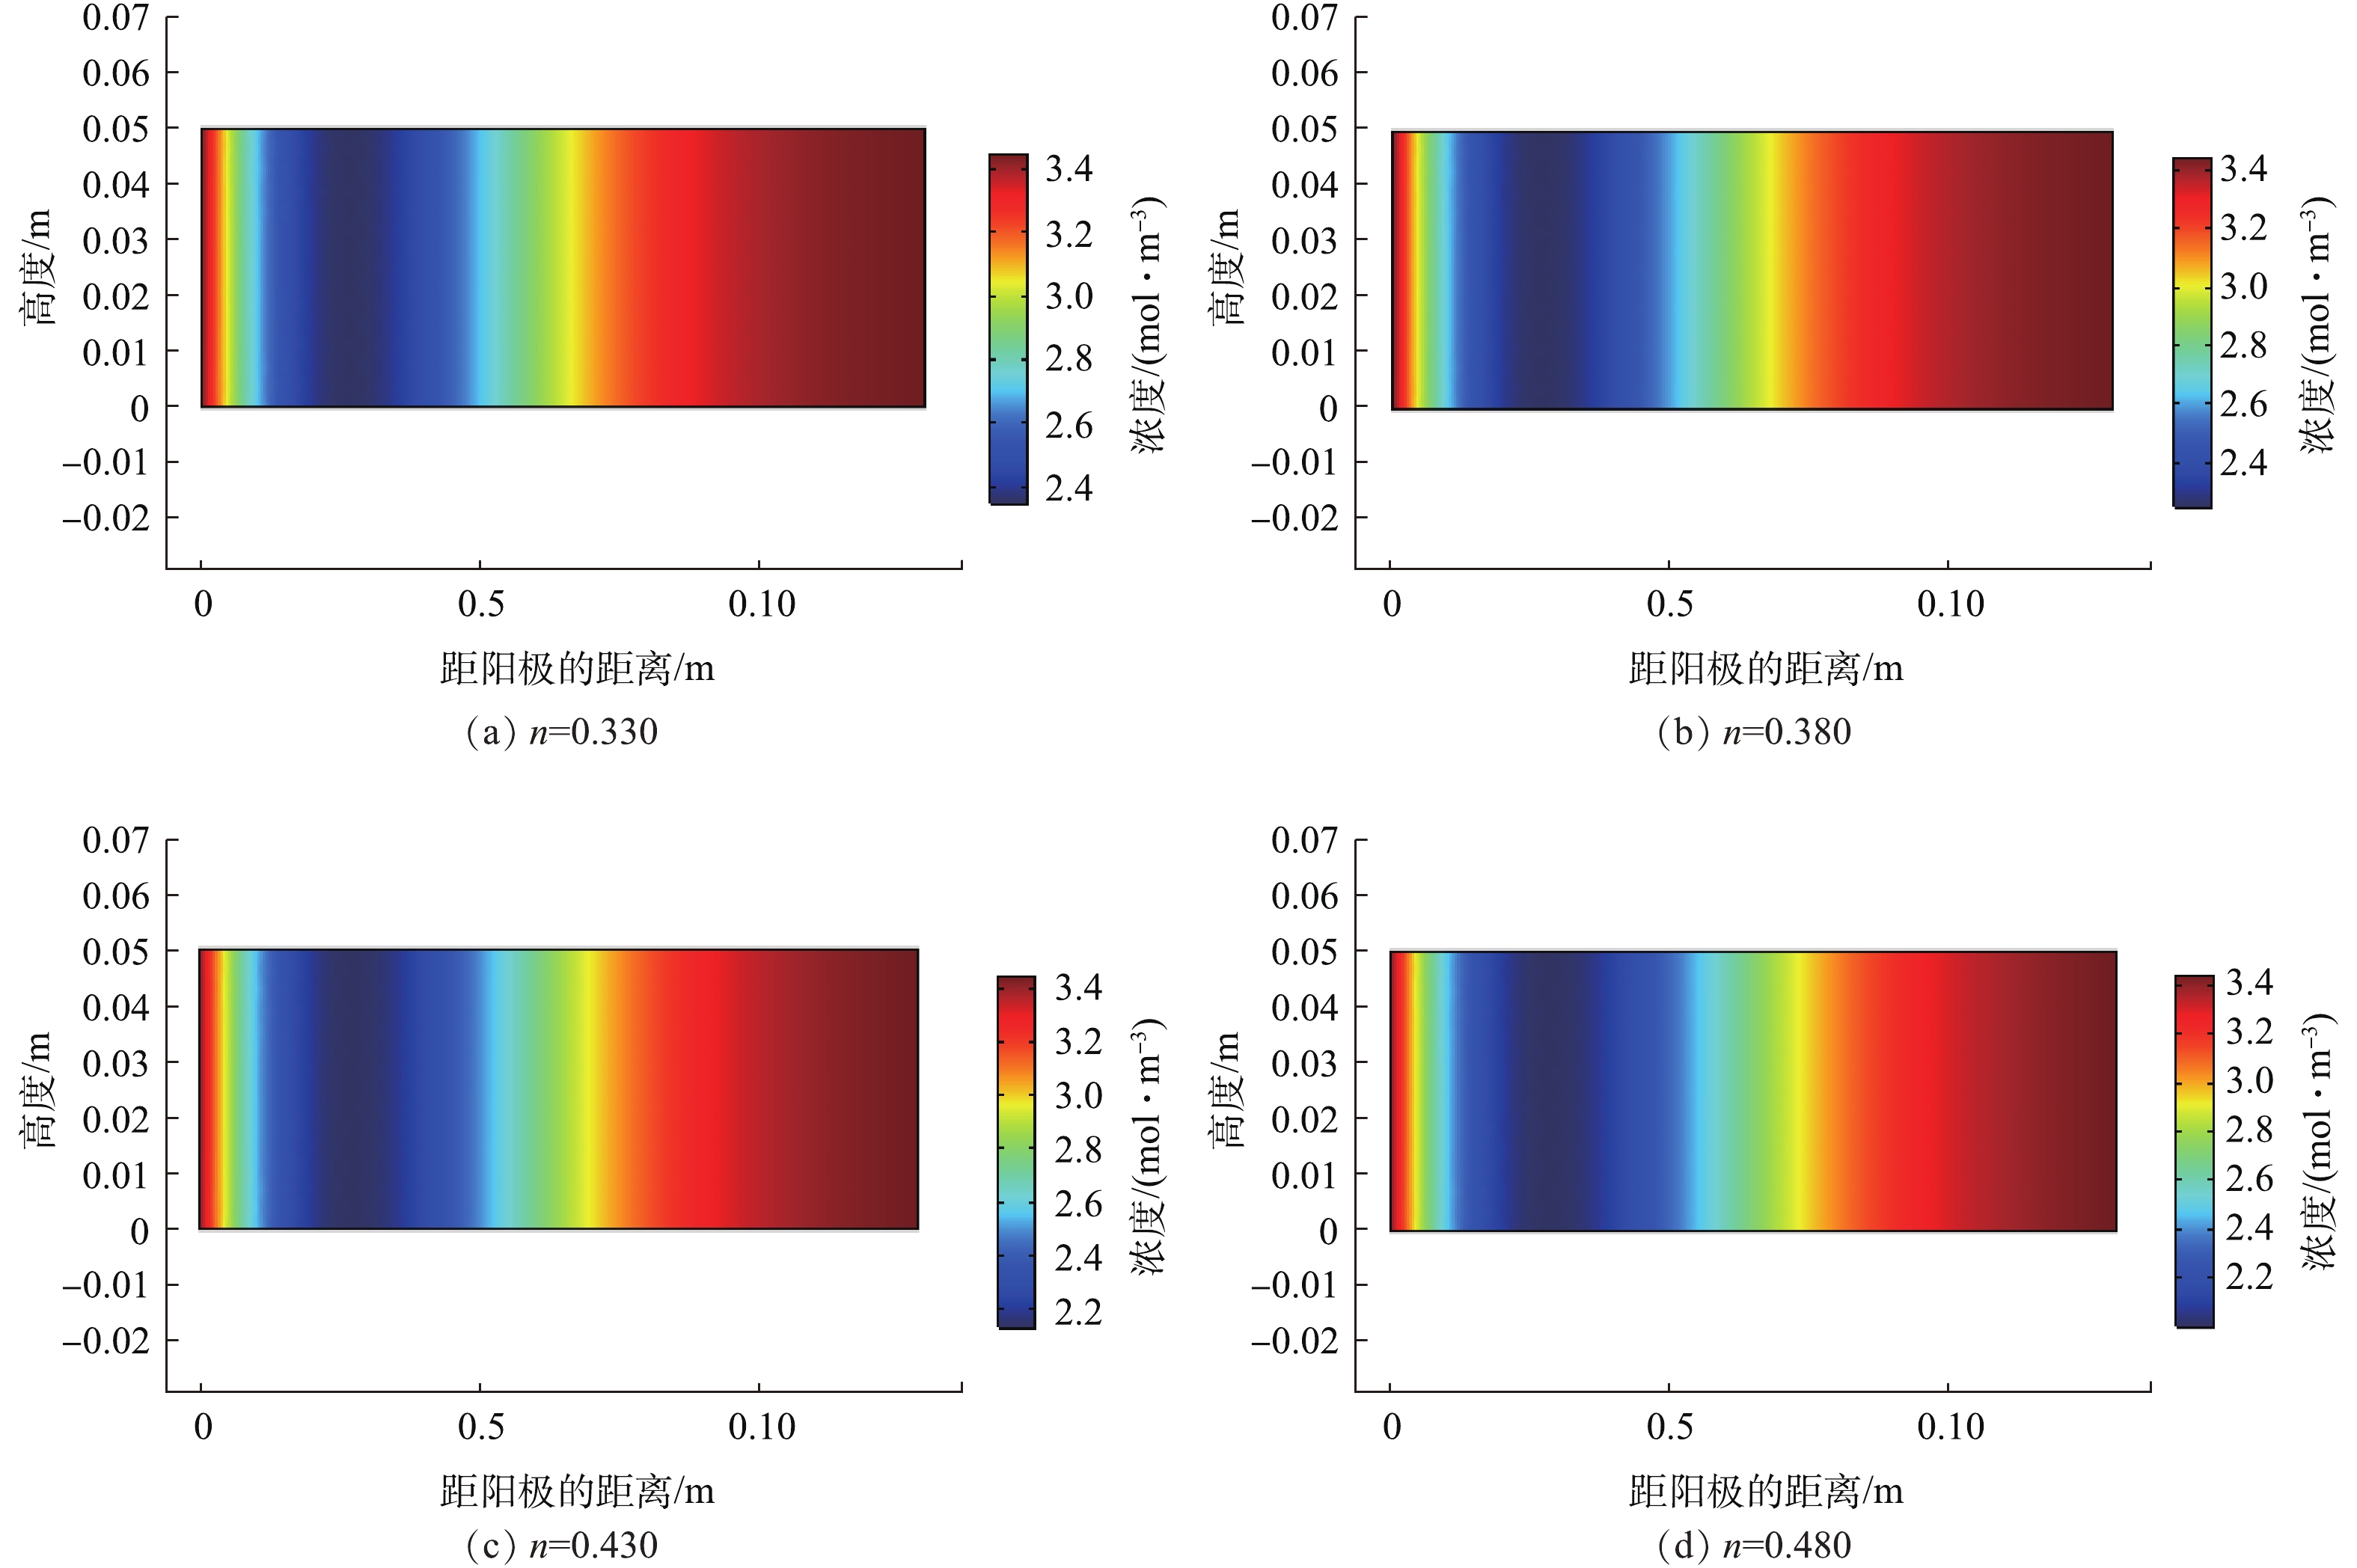
图 7 不同孔隙率下菲的浓度分布(t=108 h)
Figure 7. Concentration distribution of phenanthrene at different porosities (t=108 h)
-

图 8 不同的电压下菲的浓度分布(t=108 h)
Figure 8. Concentration distribution of phenanthrene at different voltages(t=108 h)
Figure
8 ,Table
1 个