-

图 1 脱硫剂在不同倍数的SEM图
Figure 1. SEM images of the desulfurizer under different multiples
-
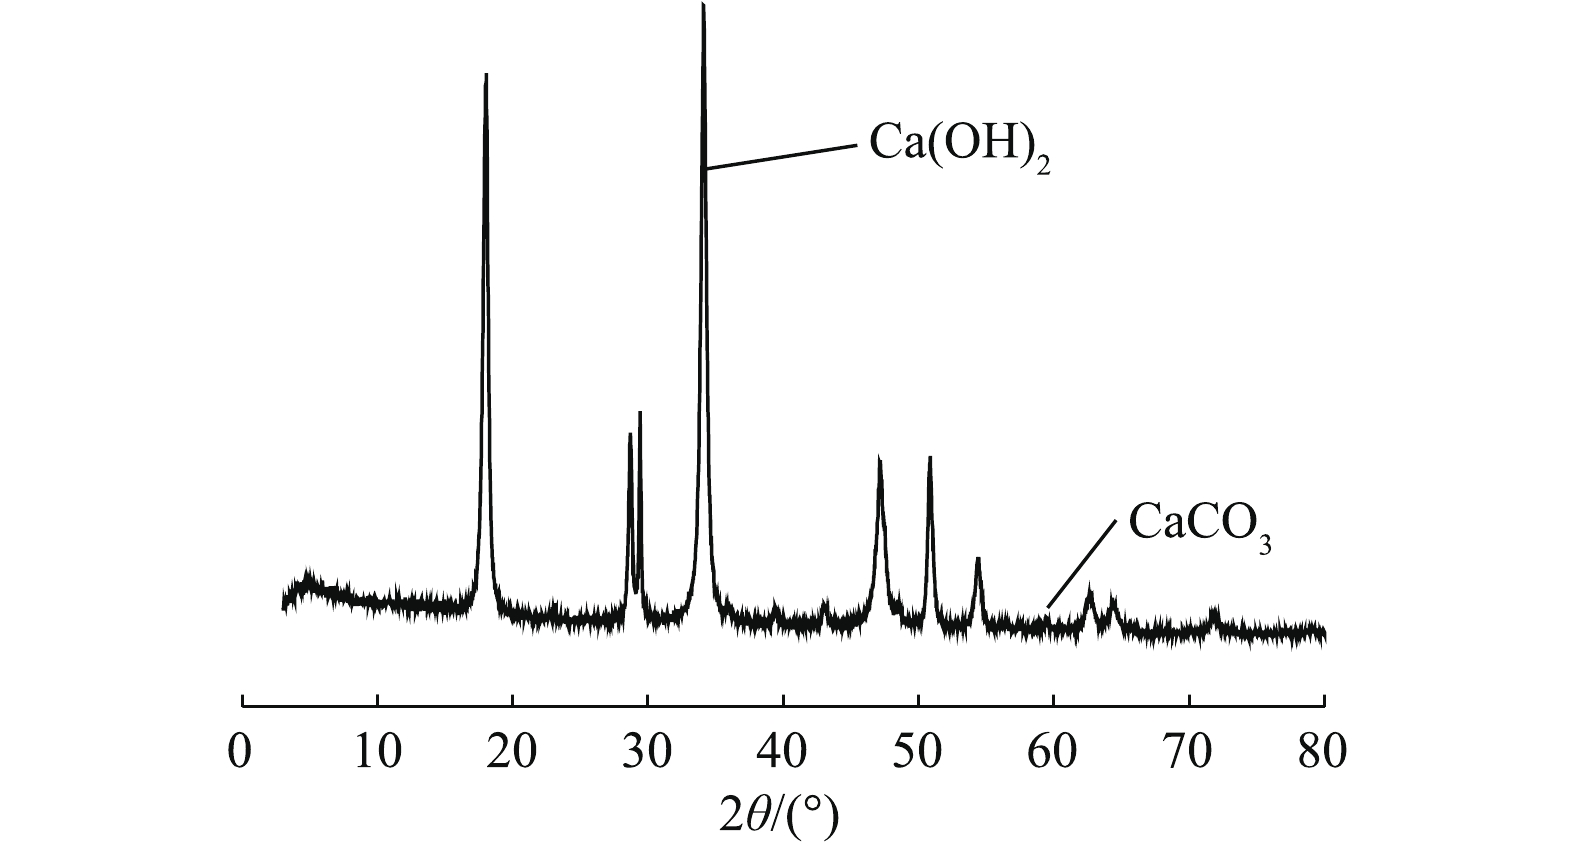
图 2 生石灰的XRD分析
Figure 2. XRD pattern of the desulfurizer obtained
-

图 3 烟气脱硫实验装置
Figure 3. Schematic diagram of desulfurization experiment device
-
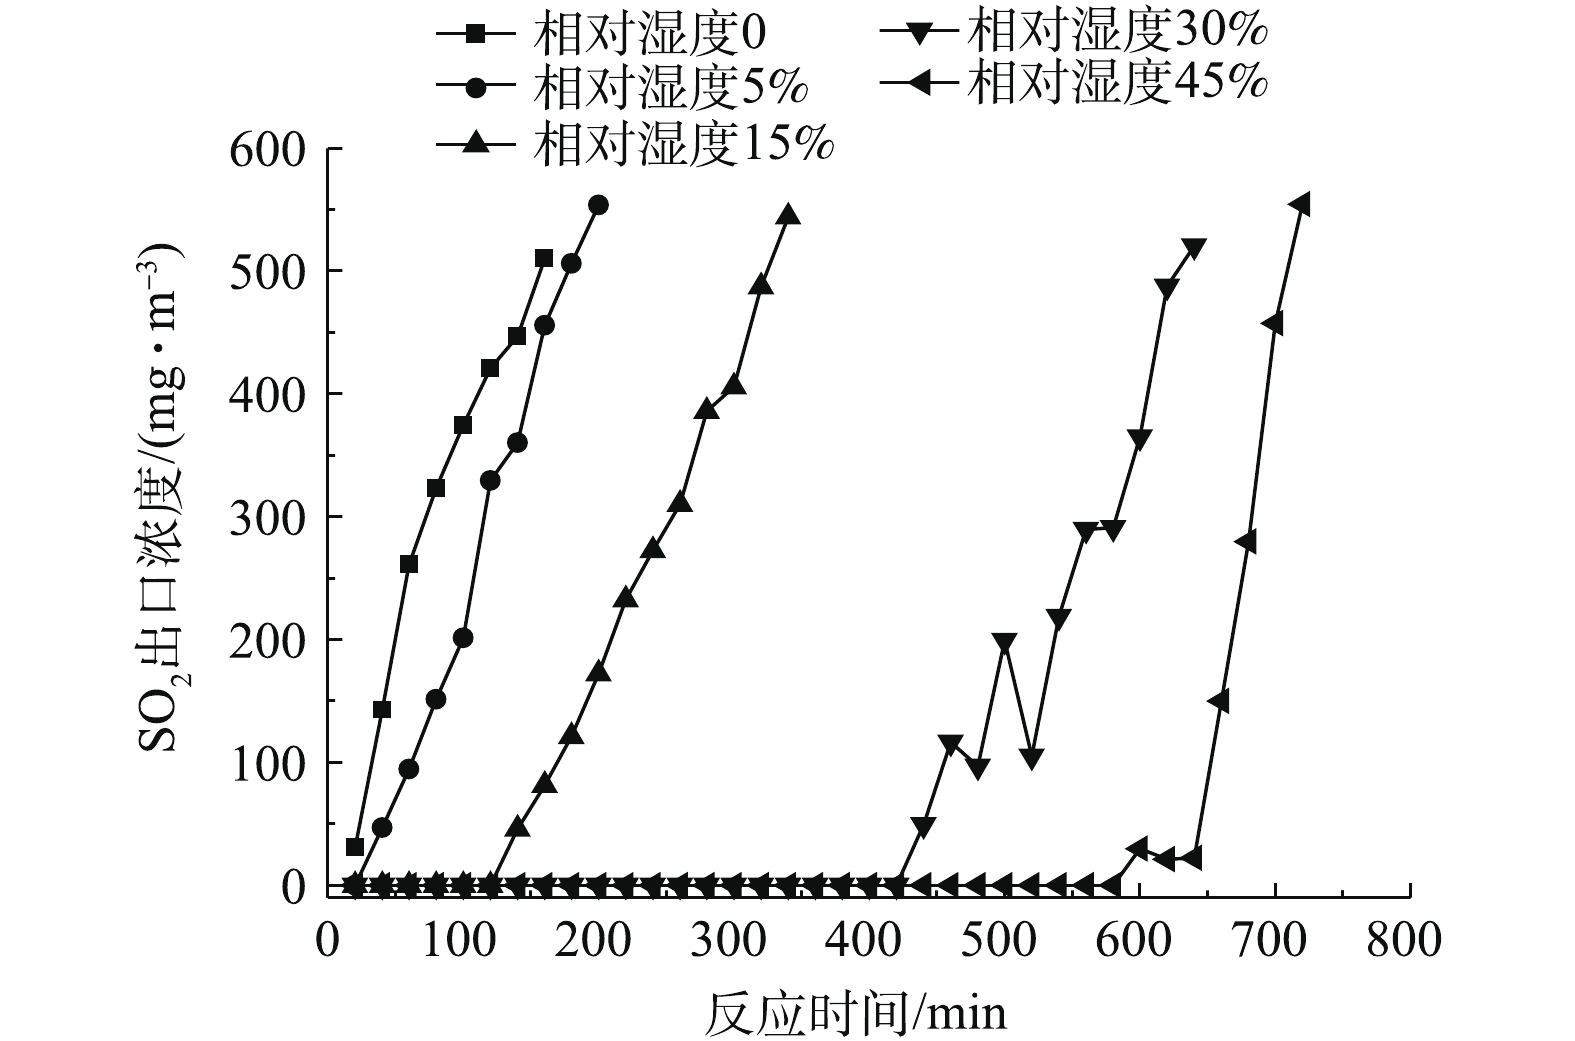
图 4 烟气SO2出口浓度与反应时间的关系
Figure 4. Relationship between SO2 concentration in the outlet and testing time under different relative humidity
-
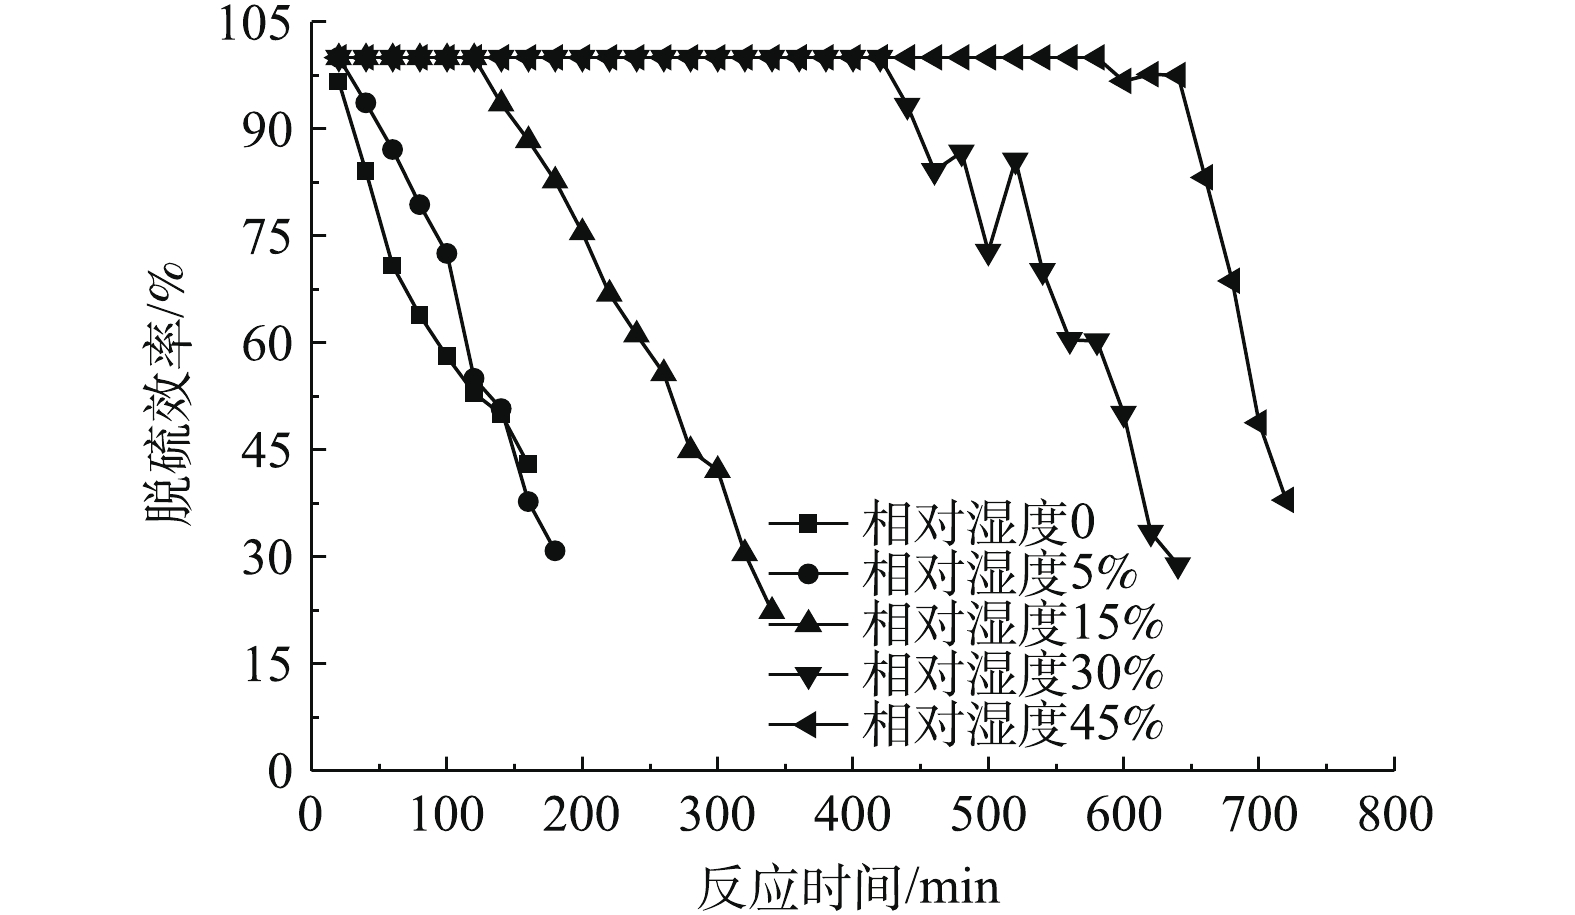
图 5 脱硫效率随着反应时间的变化
Figure 5. Change of SO2 desulphurization efficiency with time under different relative humidity
-
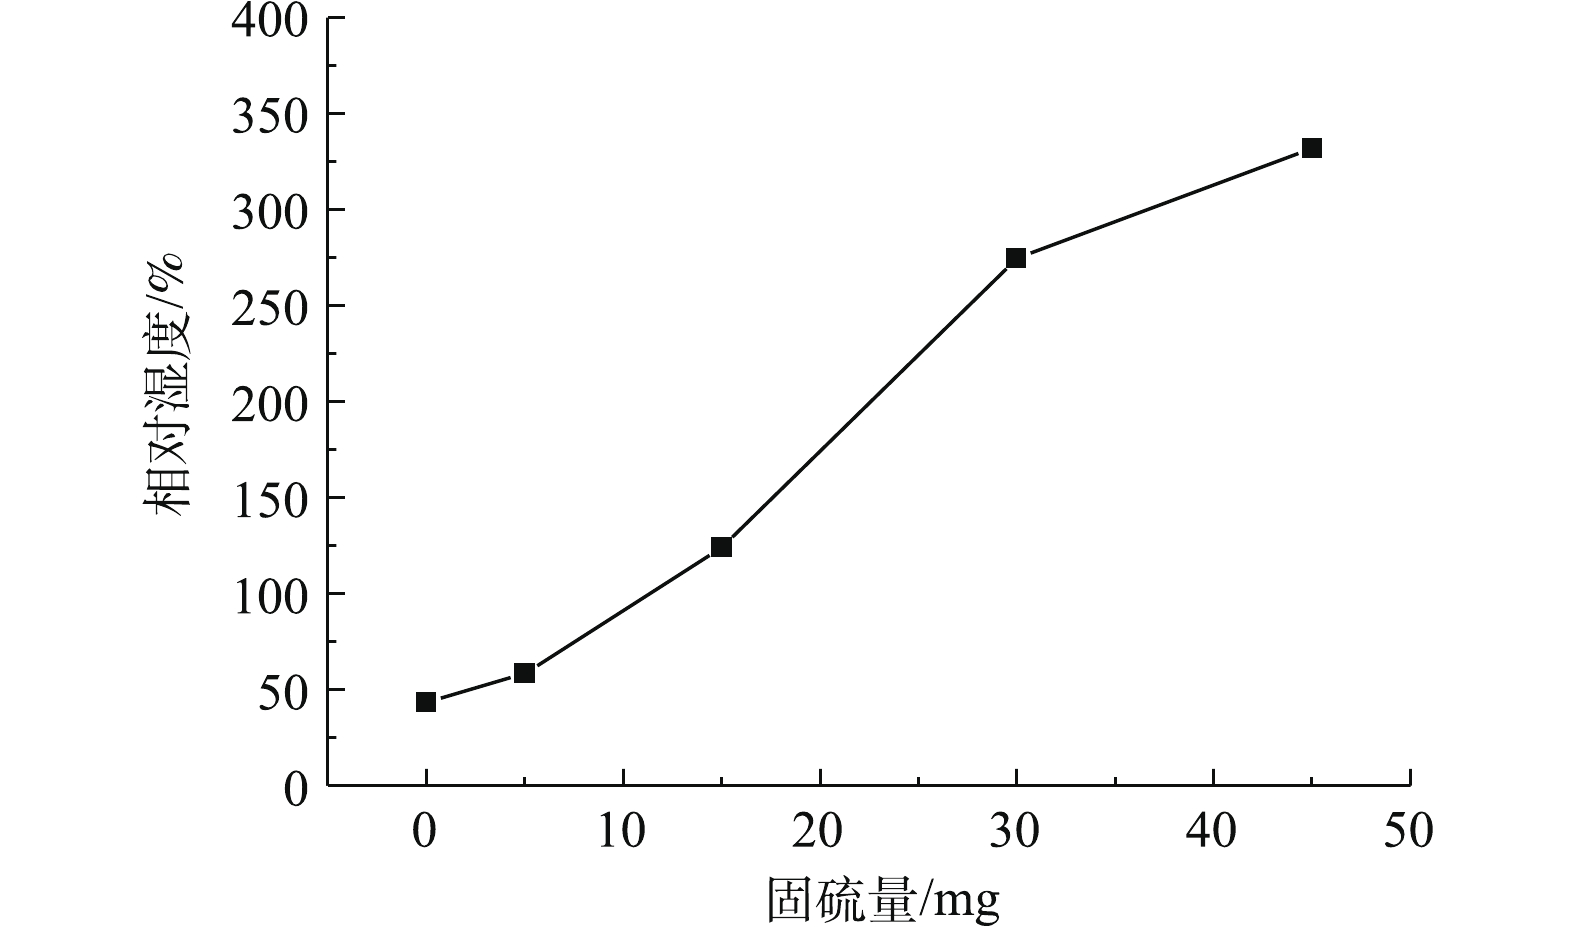
图 6 不同相对湿度下的固硫量的比较
Figure 6. Comparison of the sulfur fixation amounts among different relative humidity levels
-
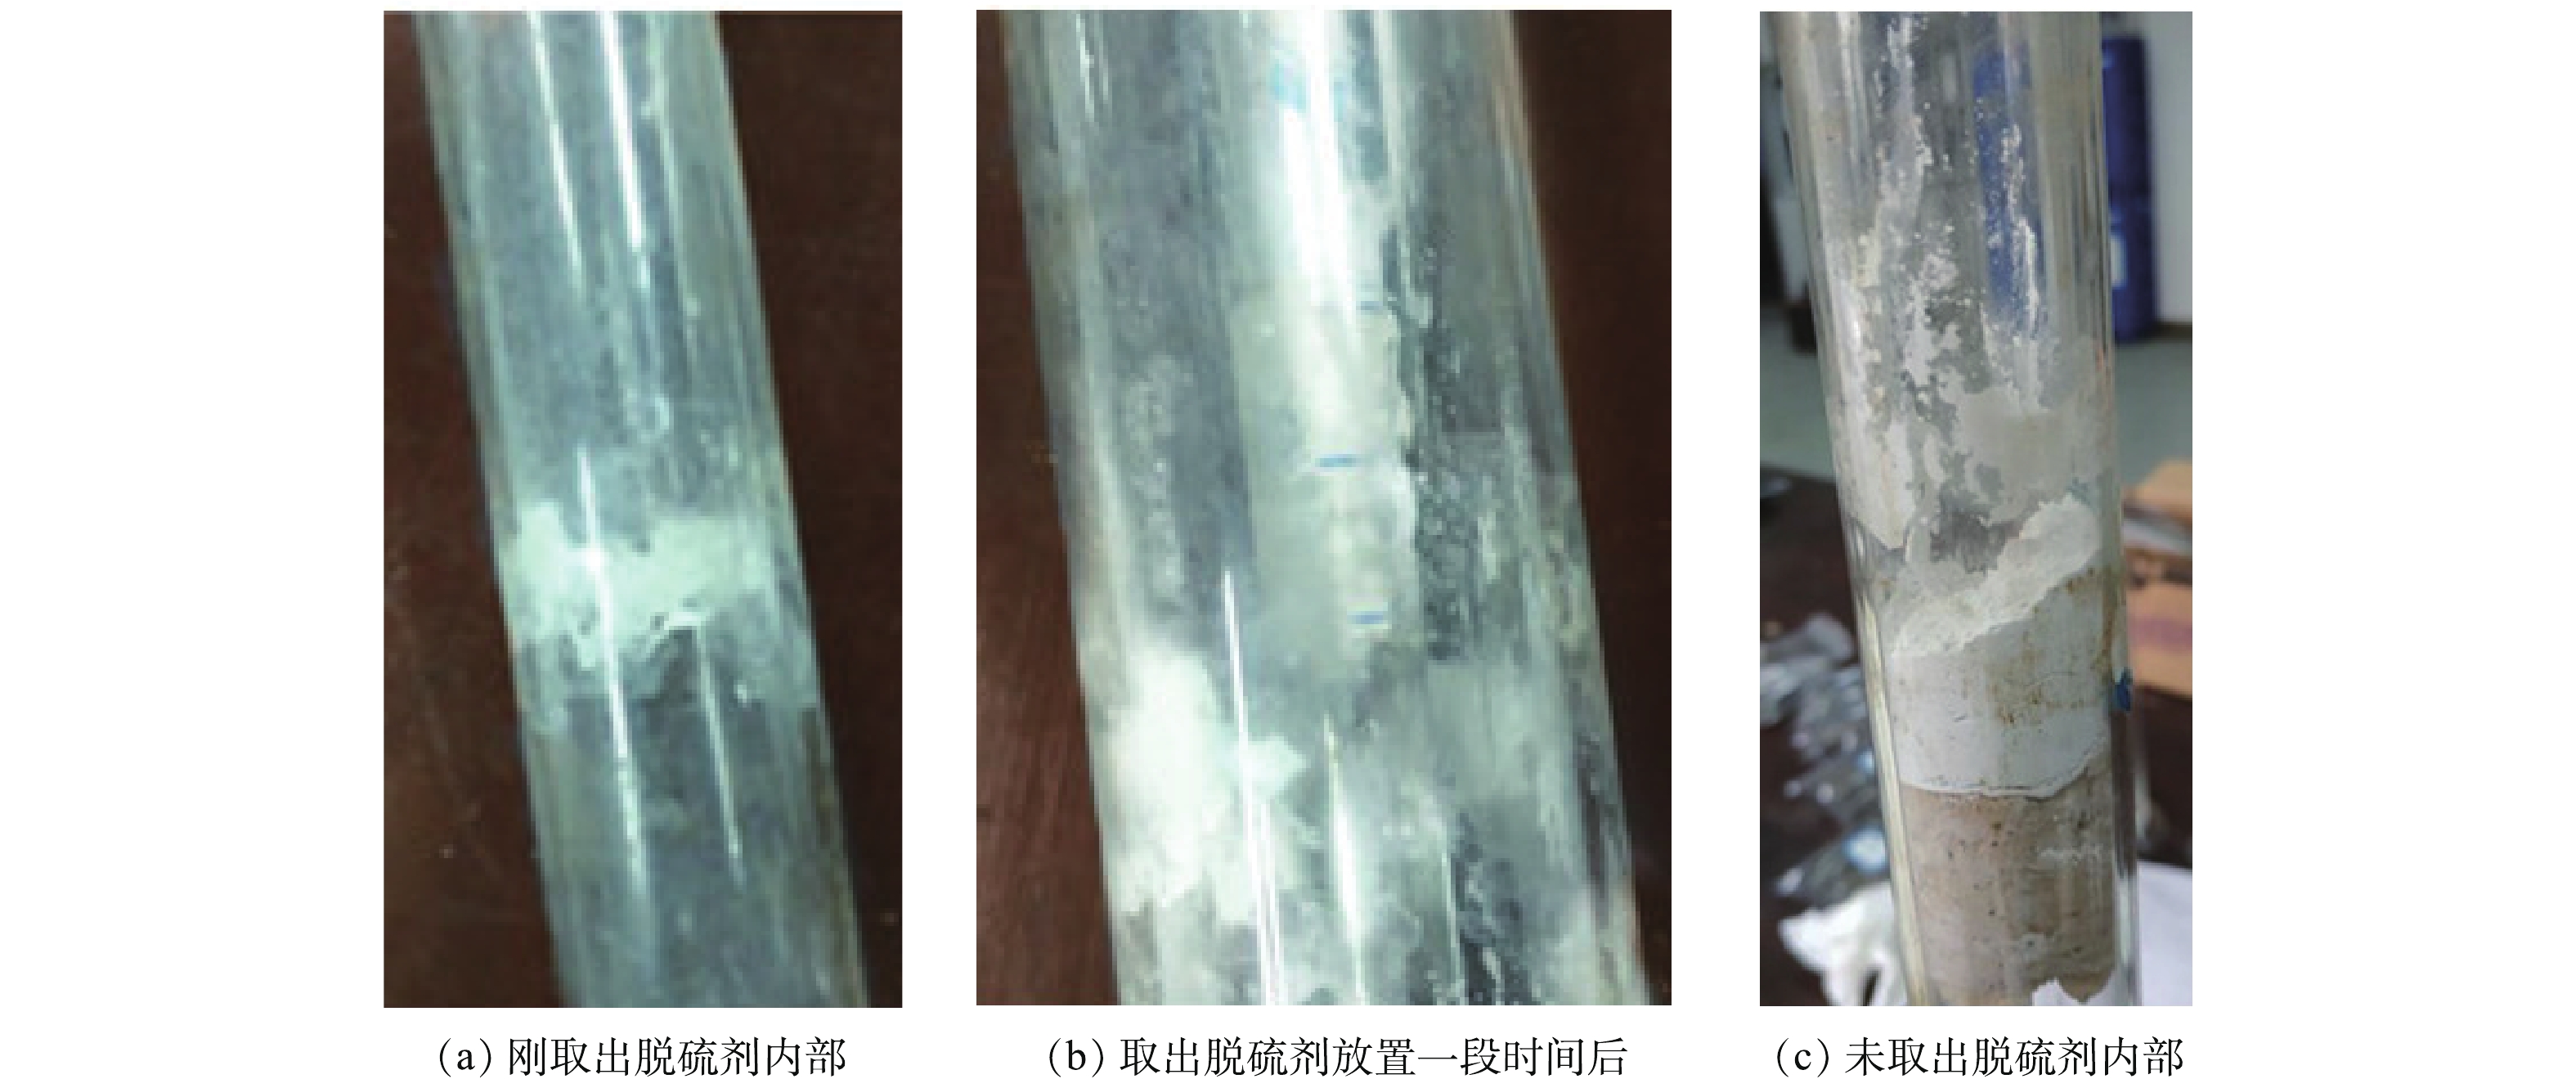
图 7 相对湿度45%运行一段时间后脱硫层内部
Figure 7. Images for the inside of desulfurization layer after a period running at the relative humidity of 45%
Figure
7 ,Table
0 个