-

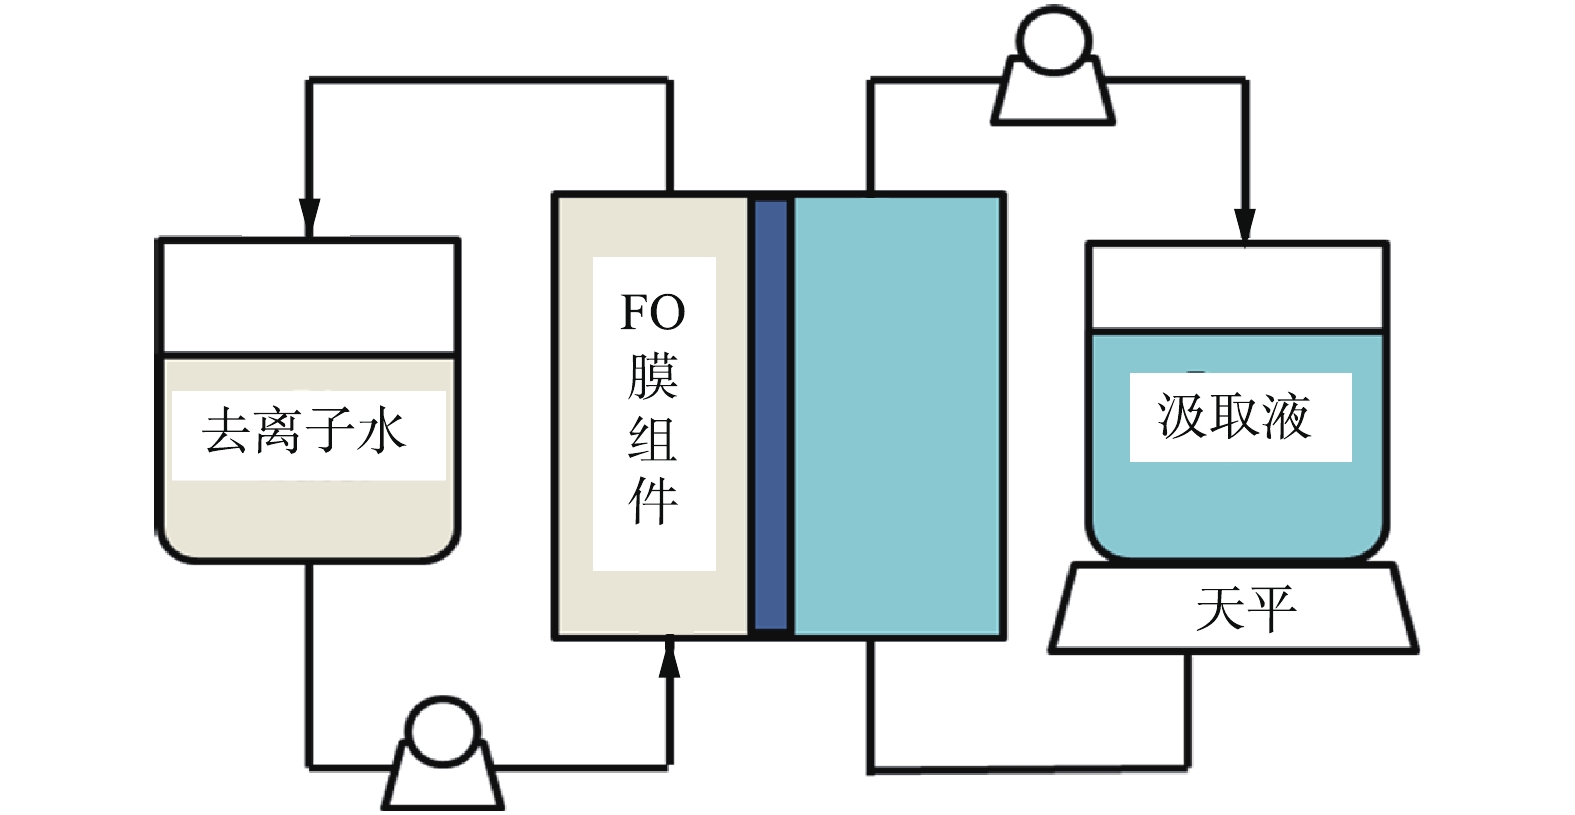
图 1 实验室规模FO系统示意图
Figure 1. Schematic diagram of bench-scale FO system
-

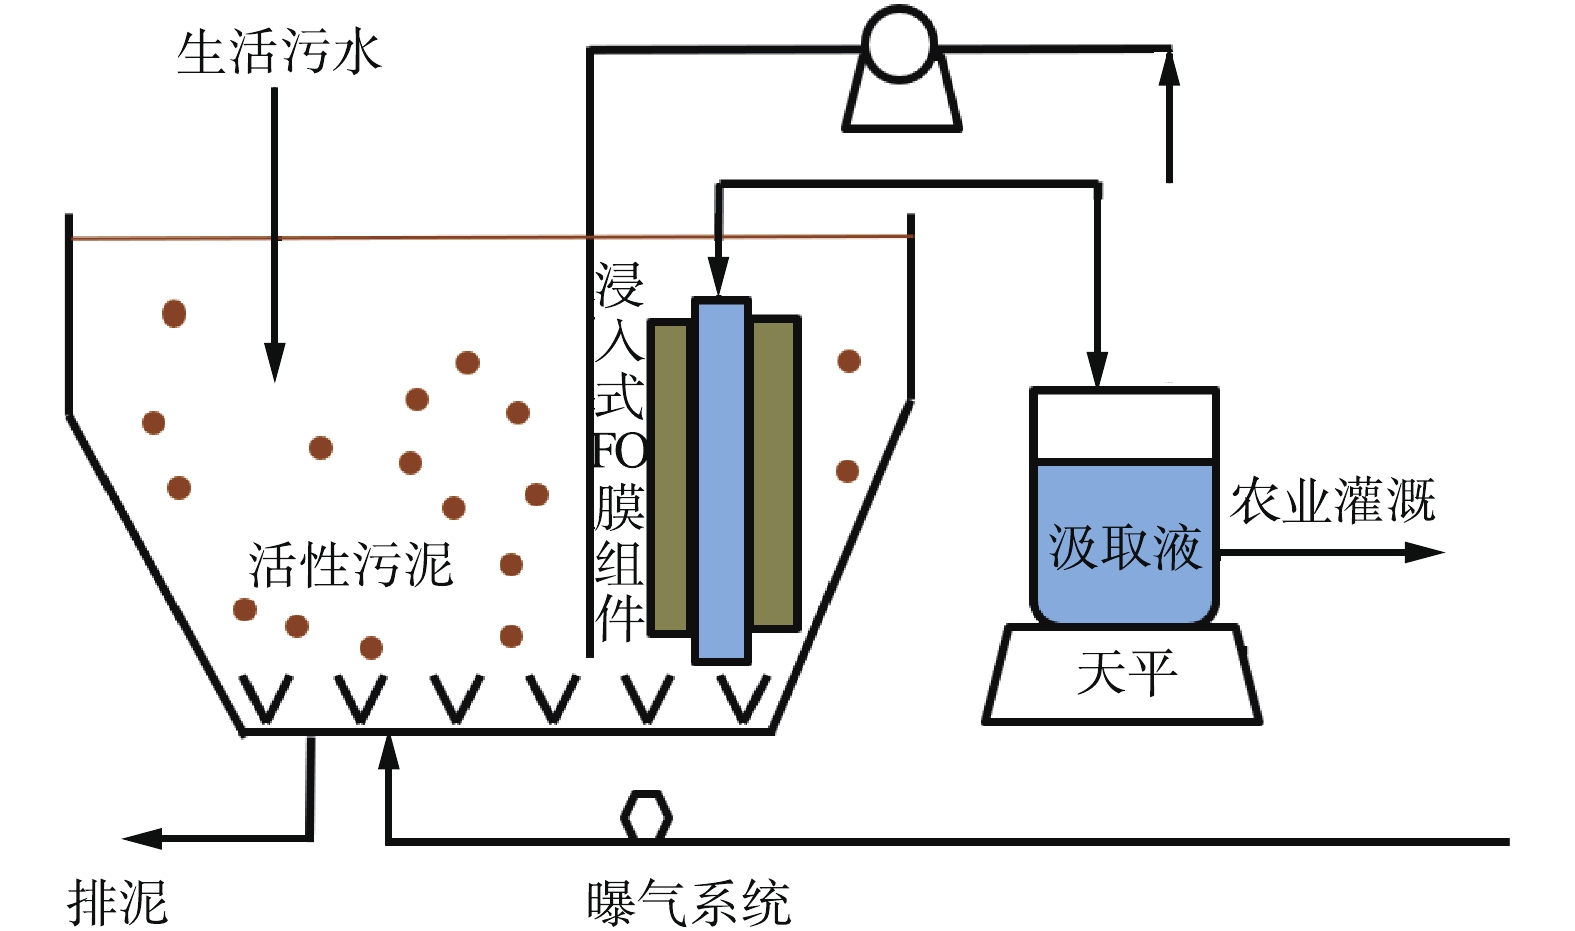
图 2 实验室规模OMBR系统示意图
Figure 2. Schematic diagram of bench-scale OMBR system
-

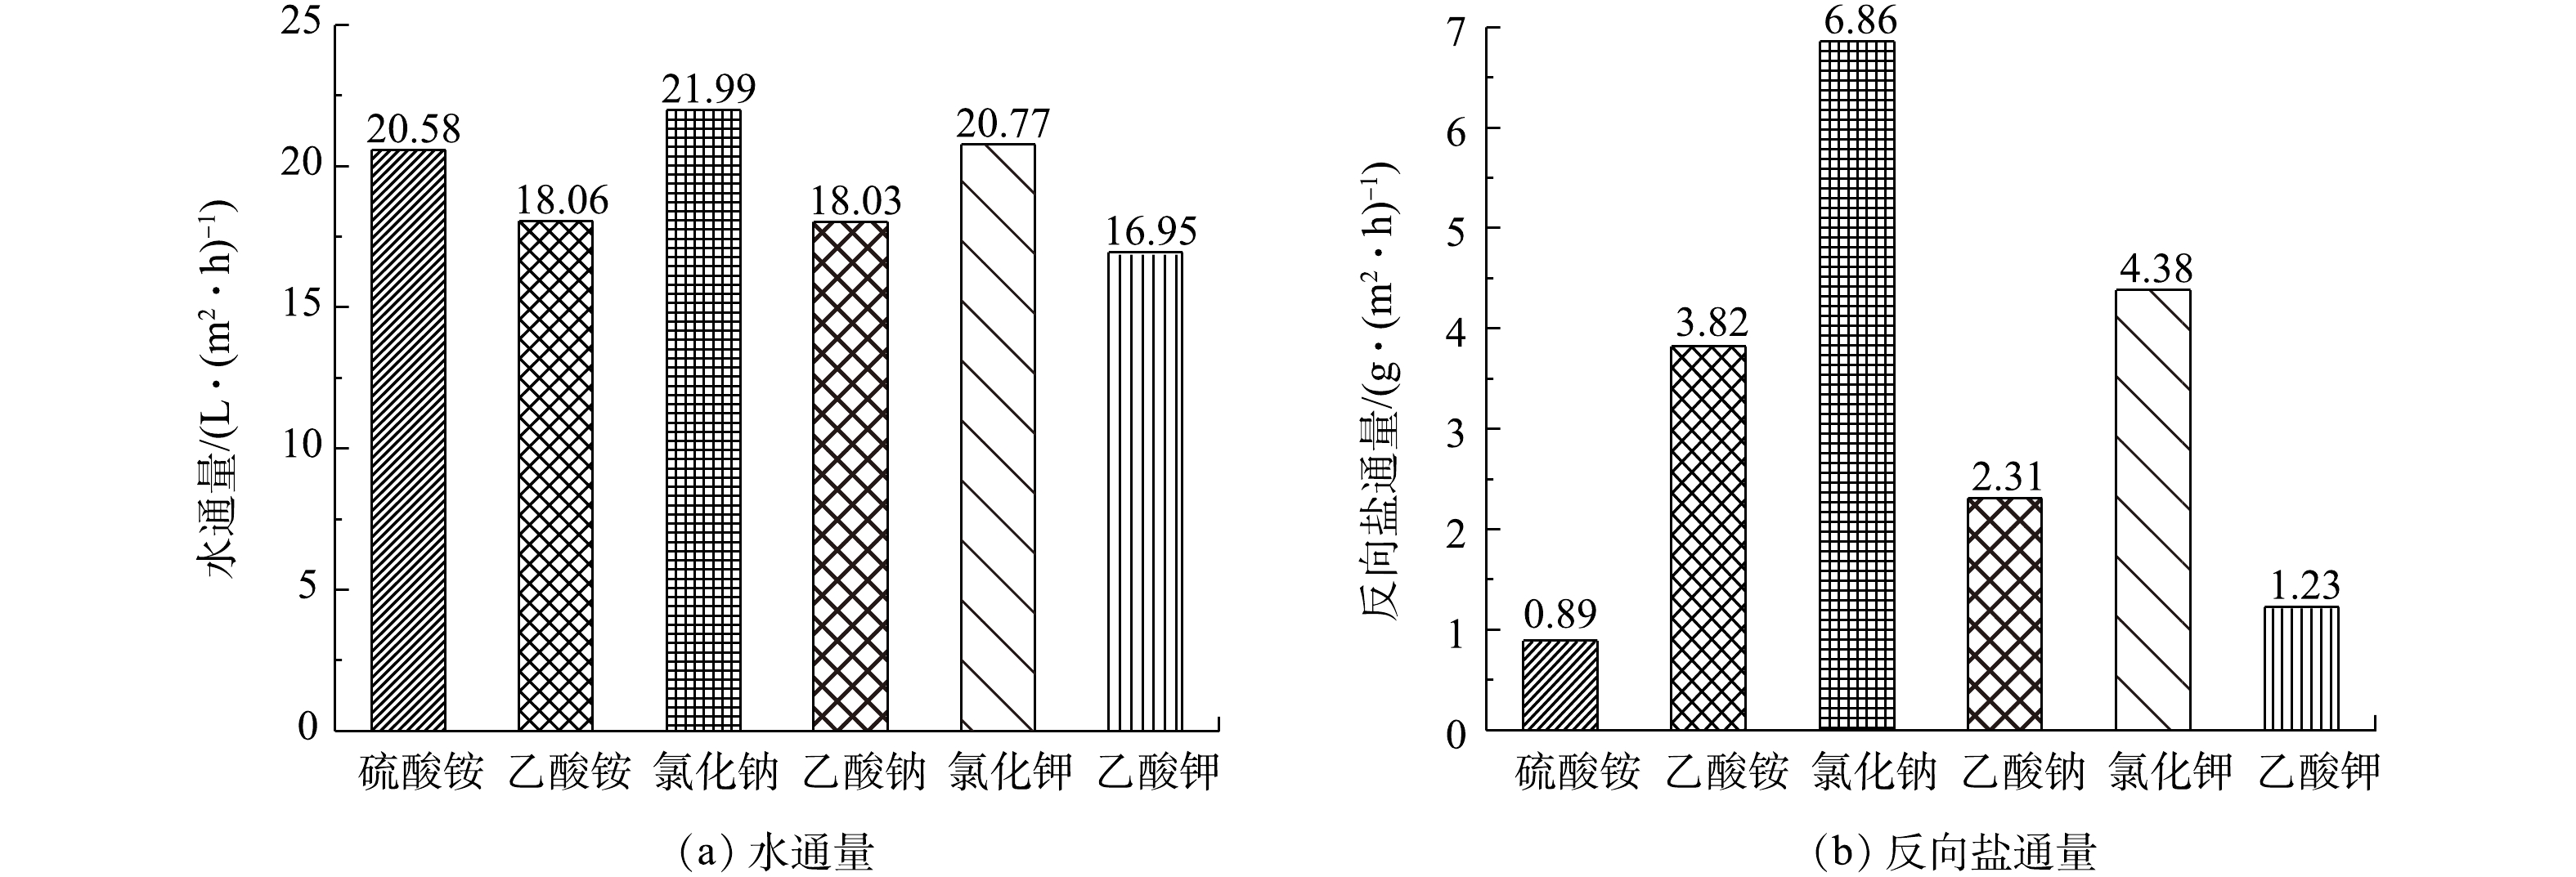
图 3 不同汲取液FO性能的比较
Figure 3. Comparison of FO performance with different draw solutions
-

图 4 不同汲取液OMBR中水通量的变化
Figure 4. Change of water flux of OMBR with different draw solutions
-

图 5 OMBR中不同汲取液的盐累积
Figure 5. Salt accumulation in OMBR with the different draw solutions
-

图 6 OMBR中不同汲取液COD的去除率
Figure 6. COD removing efficiency of OMBR with different draw solutions
-

图 7 OMBR中不同汲取液的
${{\bf{NH}}_4^{+}} $ 和${{\bf{NO}}_3^{-}} $ 浓度Figure 7.
$ {{\rm{N}}{{\rm{H}}^ + _4}} $ 和$ {{\rm{N}}{{\rm{O}}^ -_3}} $ concentrations of different draw solutions in OMBR -

图 8 4 d后的膜表面实际污染
Figure 8. Membrane fouling surface after 4 d experiments
-

图 9 污染前后的膜表面SEM电镜图像
Figure 9. SEM images of membrane surface before and after fouling
Figure
9 ,Table
0 个