-
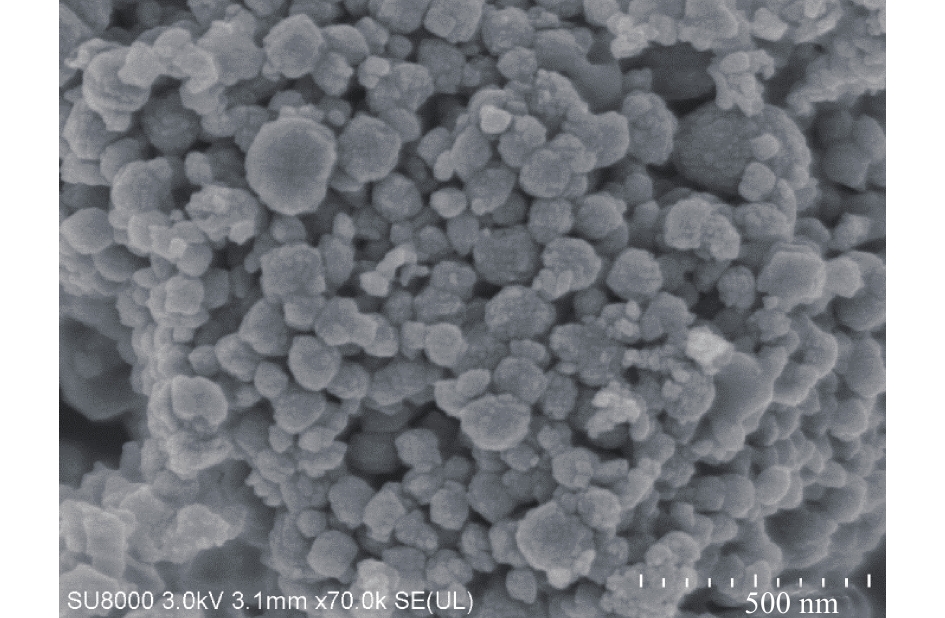
图 1 MnS纳米颗粒的扫描电镜图
Figure 1. SEM image of MnS nanoparticles
-
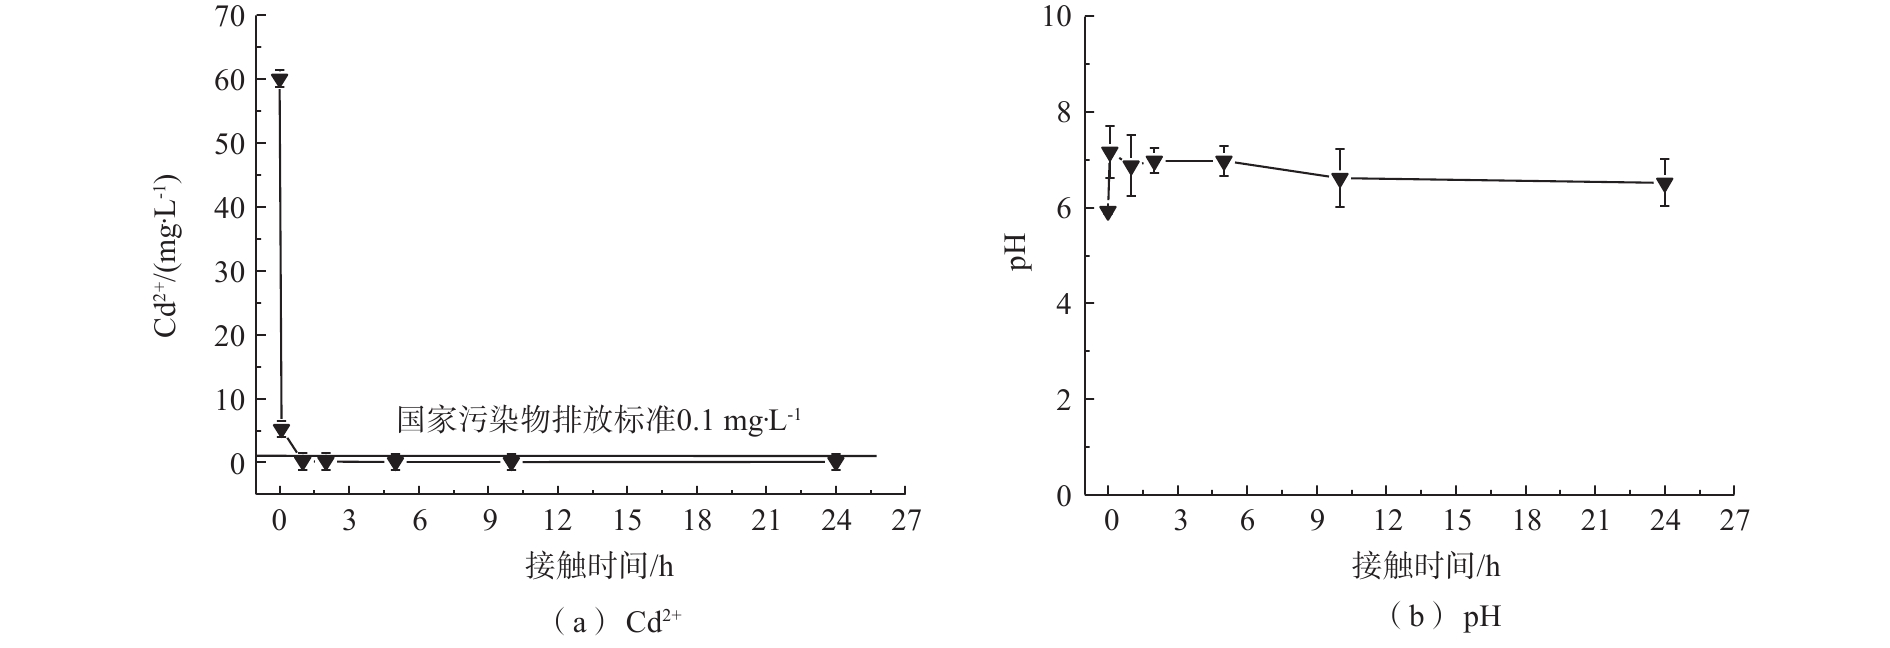
图 2 初始浓度为60 mg·L−1,MnS吸附处理下Cd2+浓度和pH随时间的变化
Figure 2. Change of Cd2+ concentration and pH with time for the solution treated by MnS at initial Cd2+ concentration of 60 mg·L−1
-
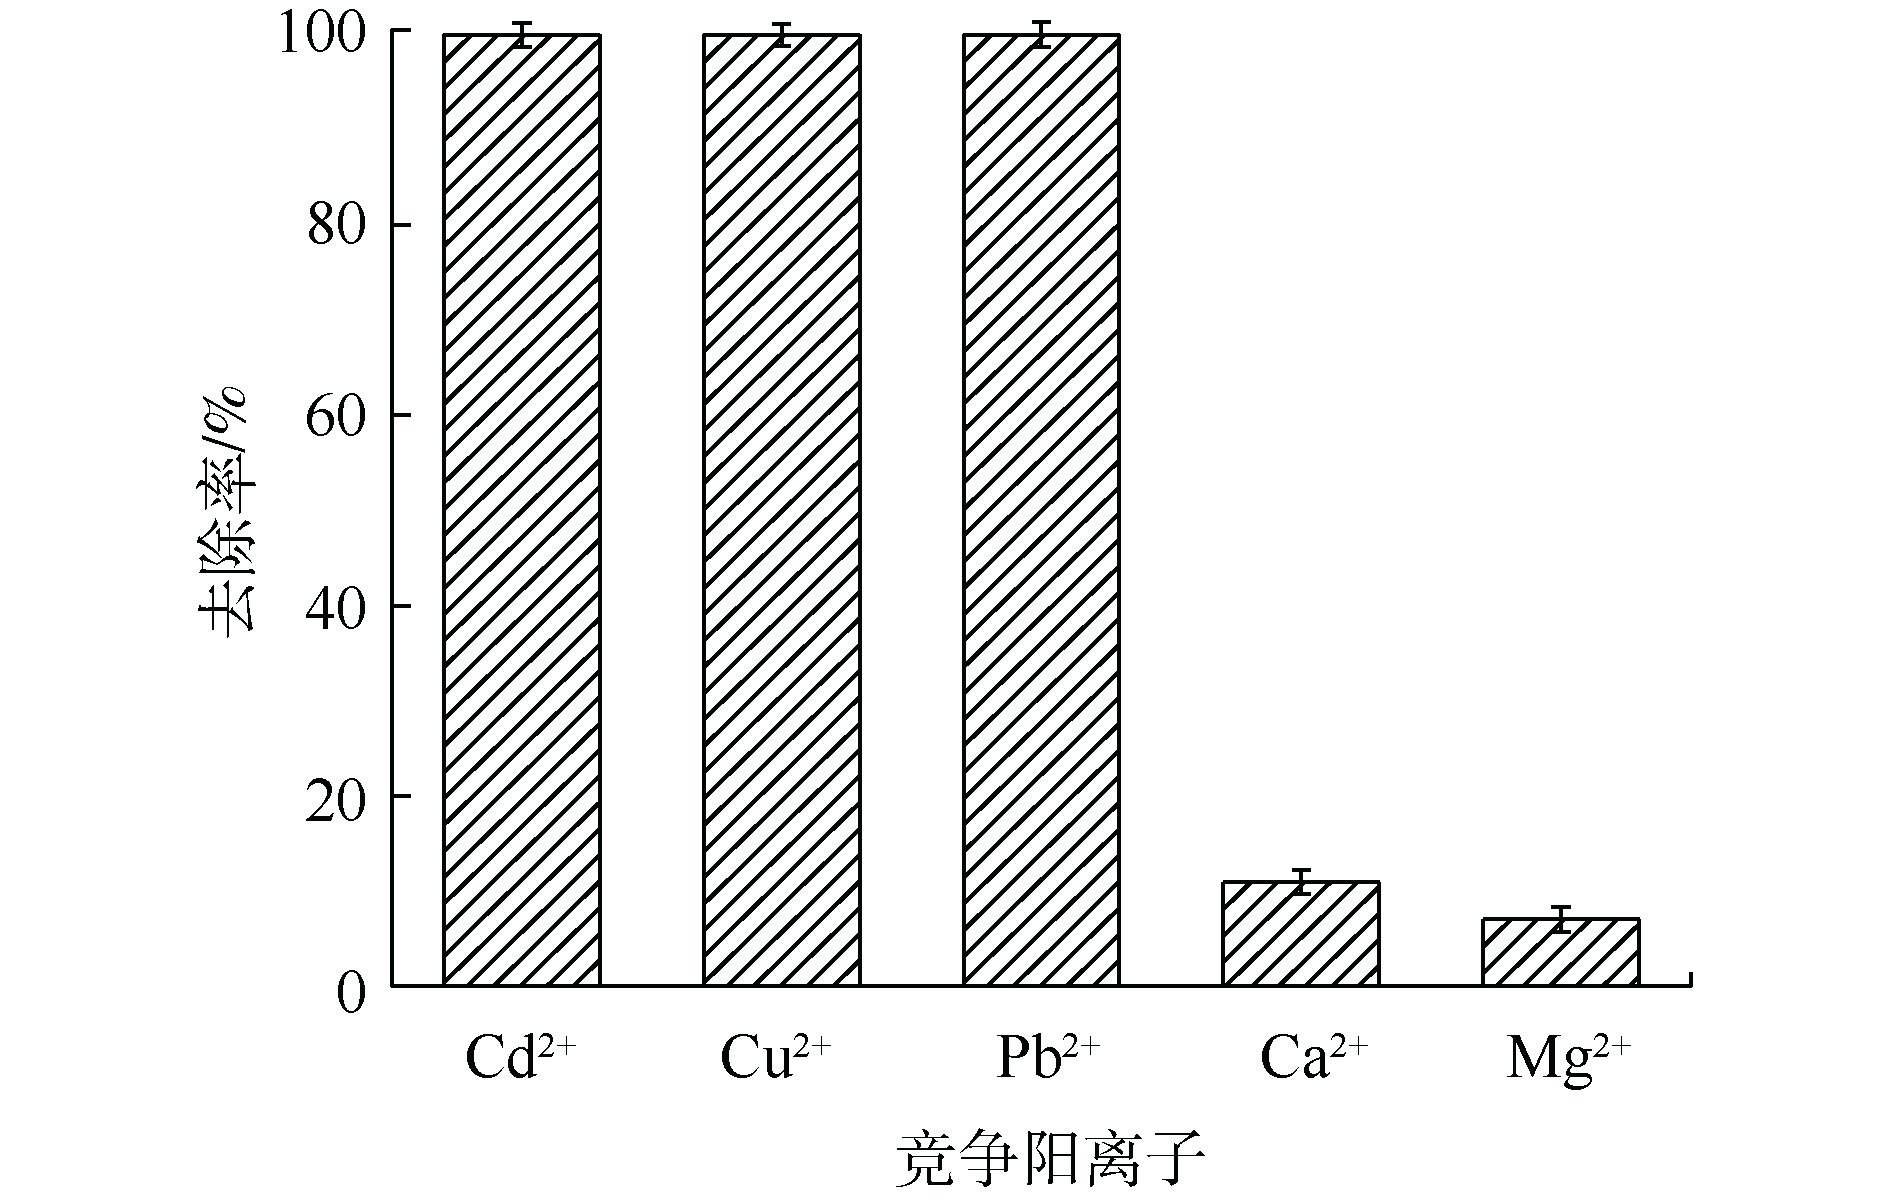
图 3 MnS在各竞争阳离子共存溶液中的吸附效果
Figure 3. Adsorption performance of MnS in the solution with coexisting competitive cations
-
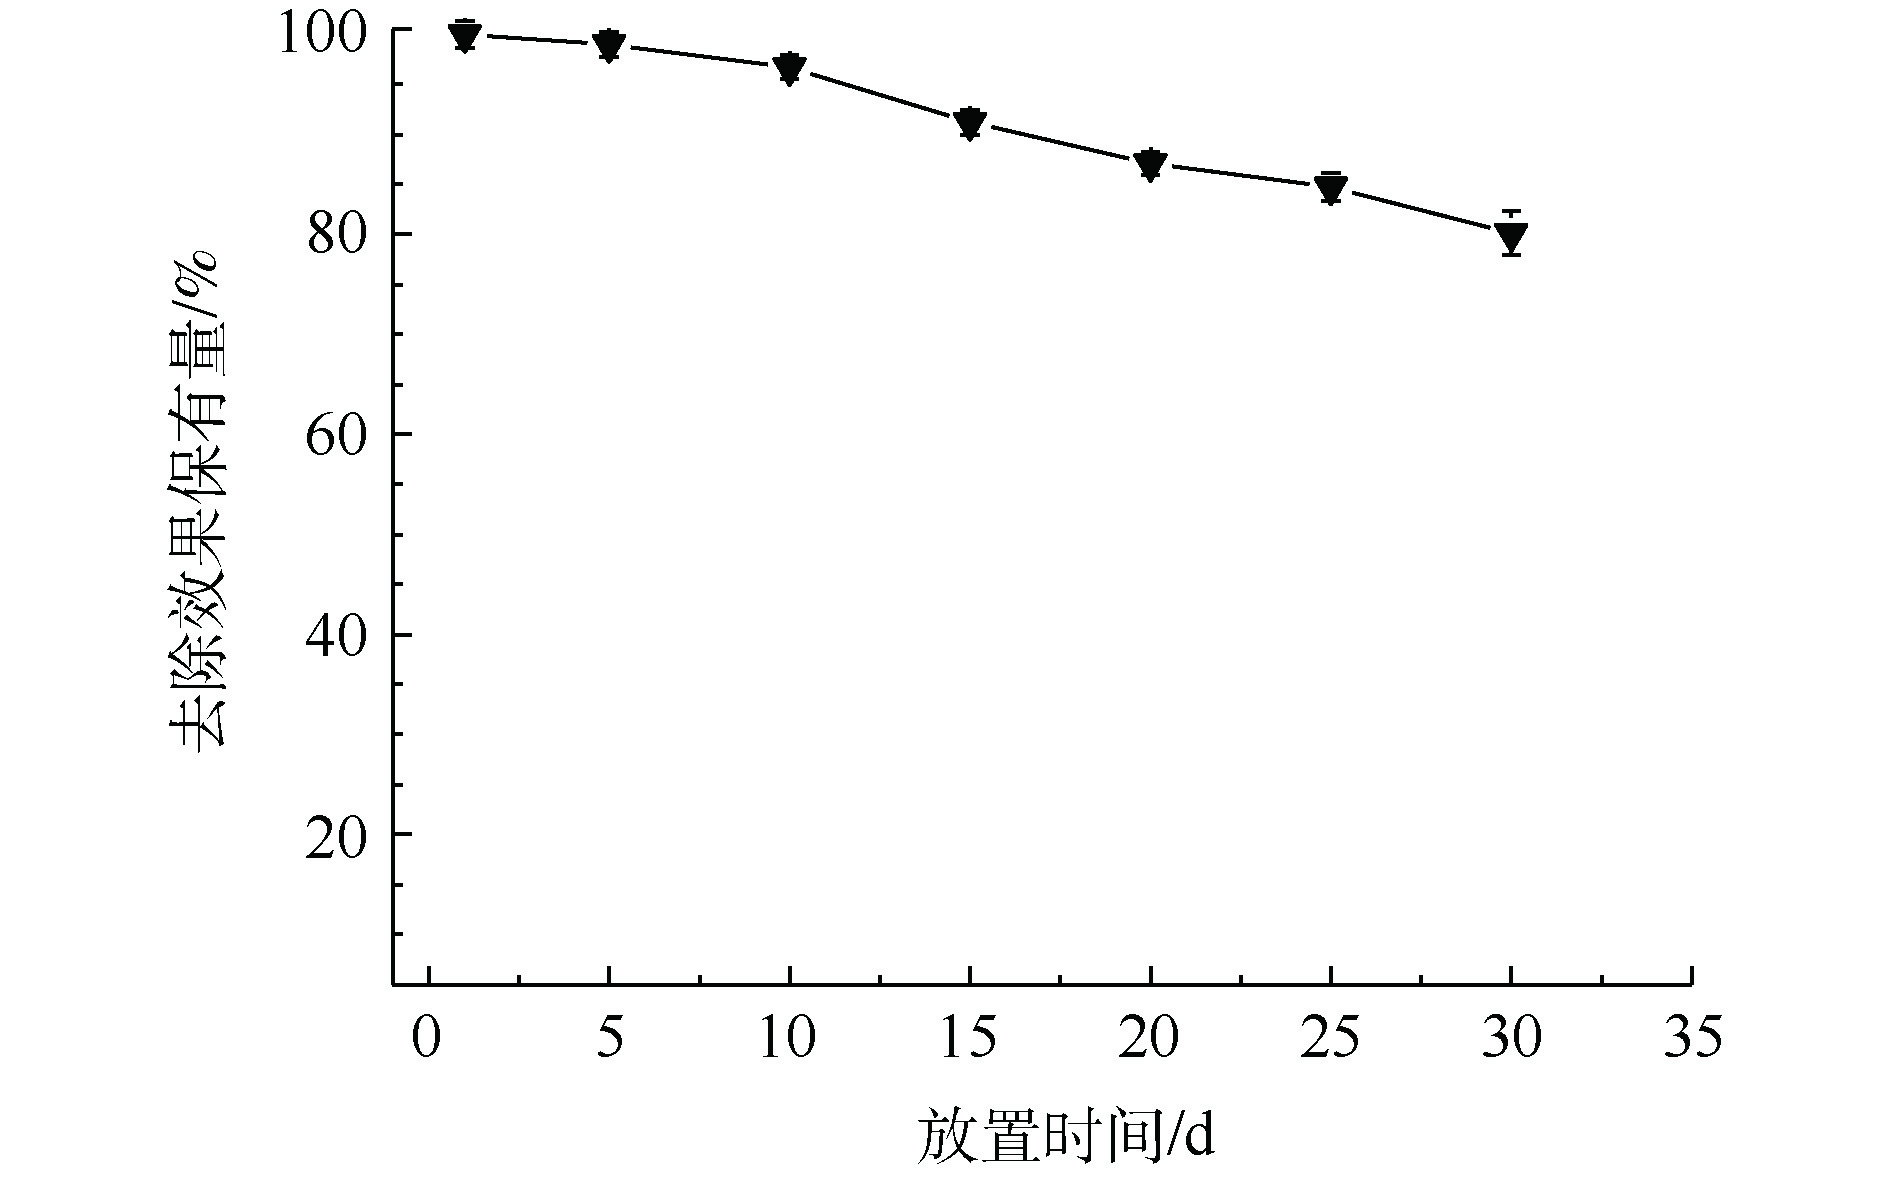
图 4 MnS纳米颗粒对于Cd2+去除率保有量随时间变化曲线
Figure 4. Change of Cd2+ removal rate retention by MnS nanoparticles with time
-
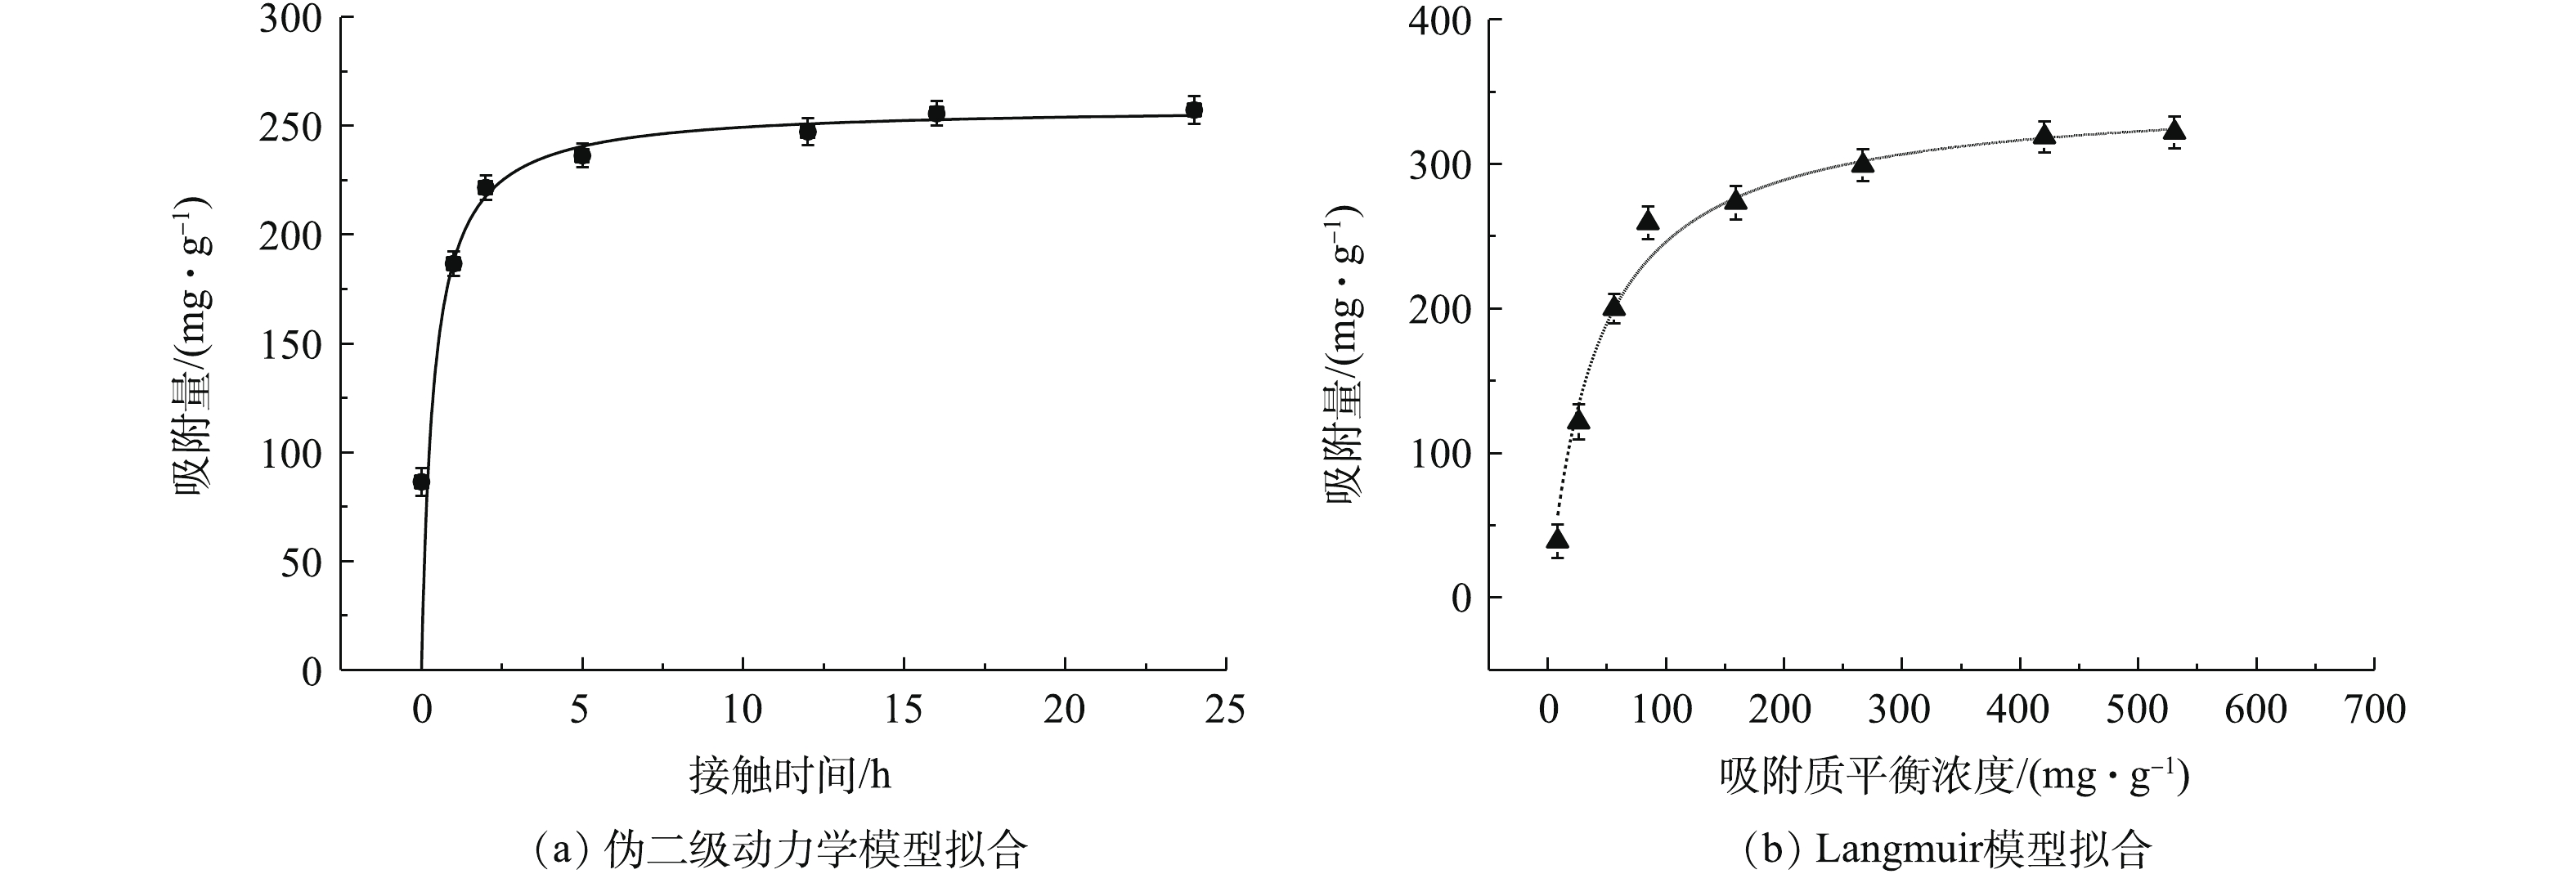
图 5 MnS吸附Cd2+的伪二级动力学模型和吸附等温线Langmuir模型拟合图
Figure 5. Pseudo-second kinetic model, adsorption isotherms and the corresponding Langmuir model fitting curve for Cd2+ adsorption by MnS nanoparticles
-

图 6 MnS纳米颗粒吸附Cd前、后XRD图谱
Figure 6. XRD patterns of MnS nanoparticle before and after adsorption of cadmium
-
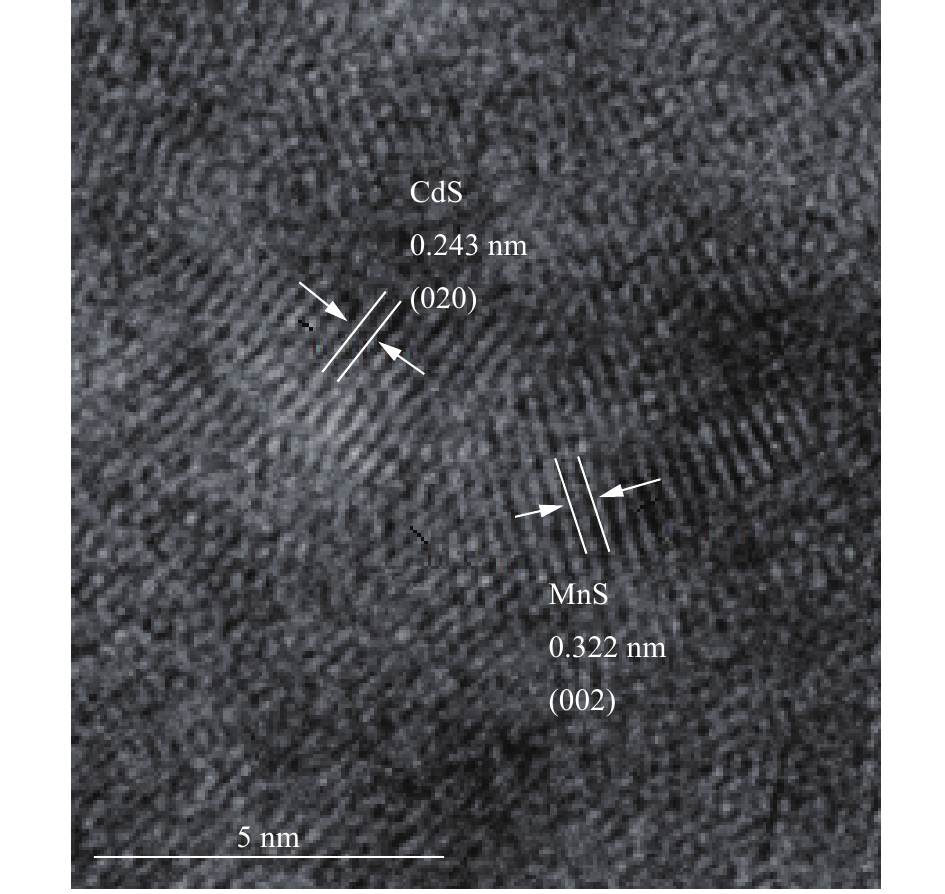
图 7 MnS纳米颗粒吸附Cd后HR-TEM图
Figure 7. HR-TEM image of MnS nanoparticles after Cd adsorption
-
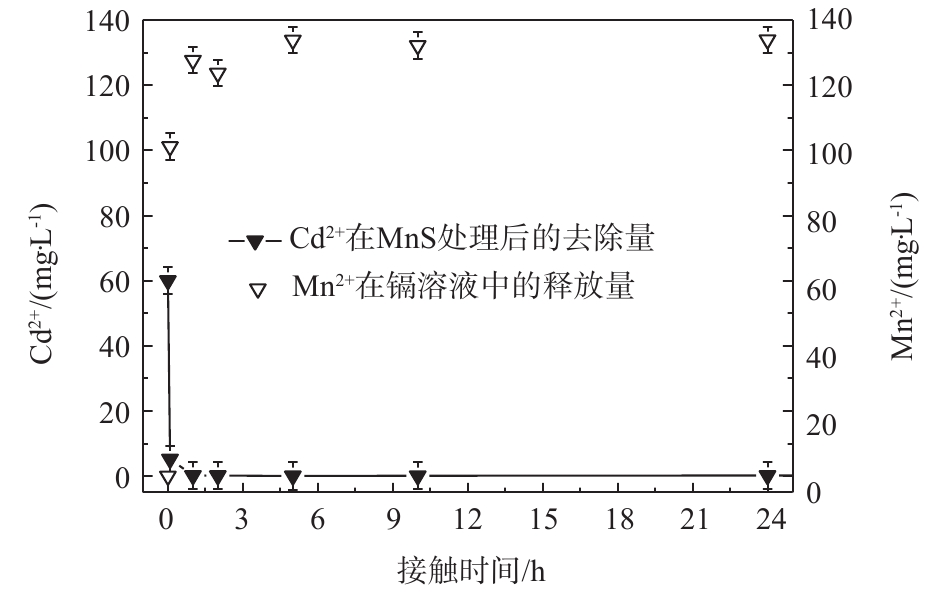
图 8 MnS纳米颗粒吸附过程中Cd2+去除量与Mn2+释放量
Figure 8. Cd2+ removal amount of and Mn2+ release amount during the adsorption process of MnS nanoparticles
Figure
8 ,Table
2 个