-

图 1 实验装置示意图
Figure 1. Schematic diagram of experimental equipment
-
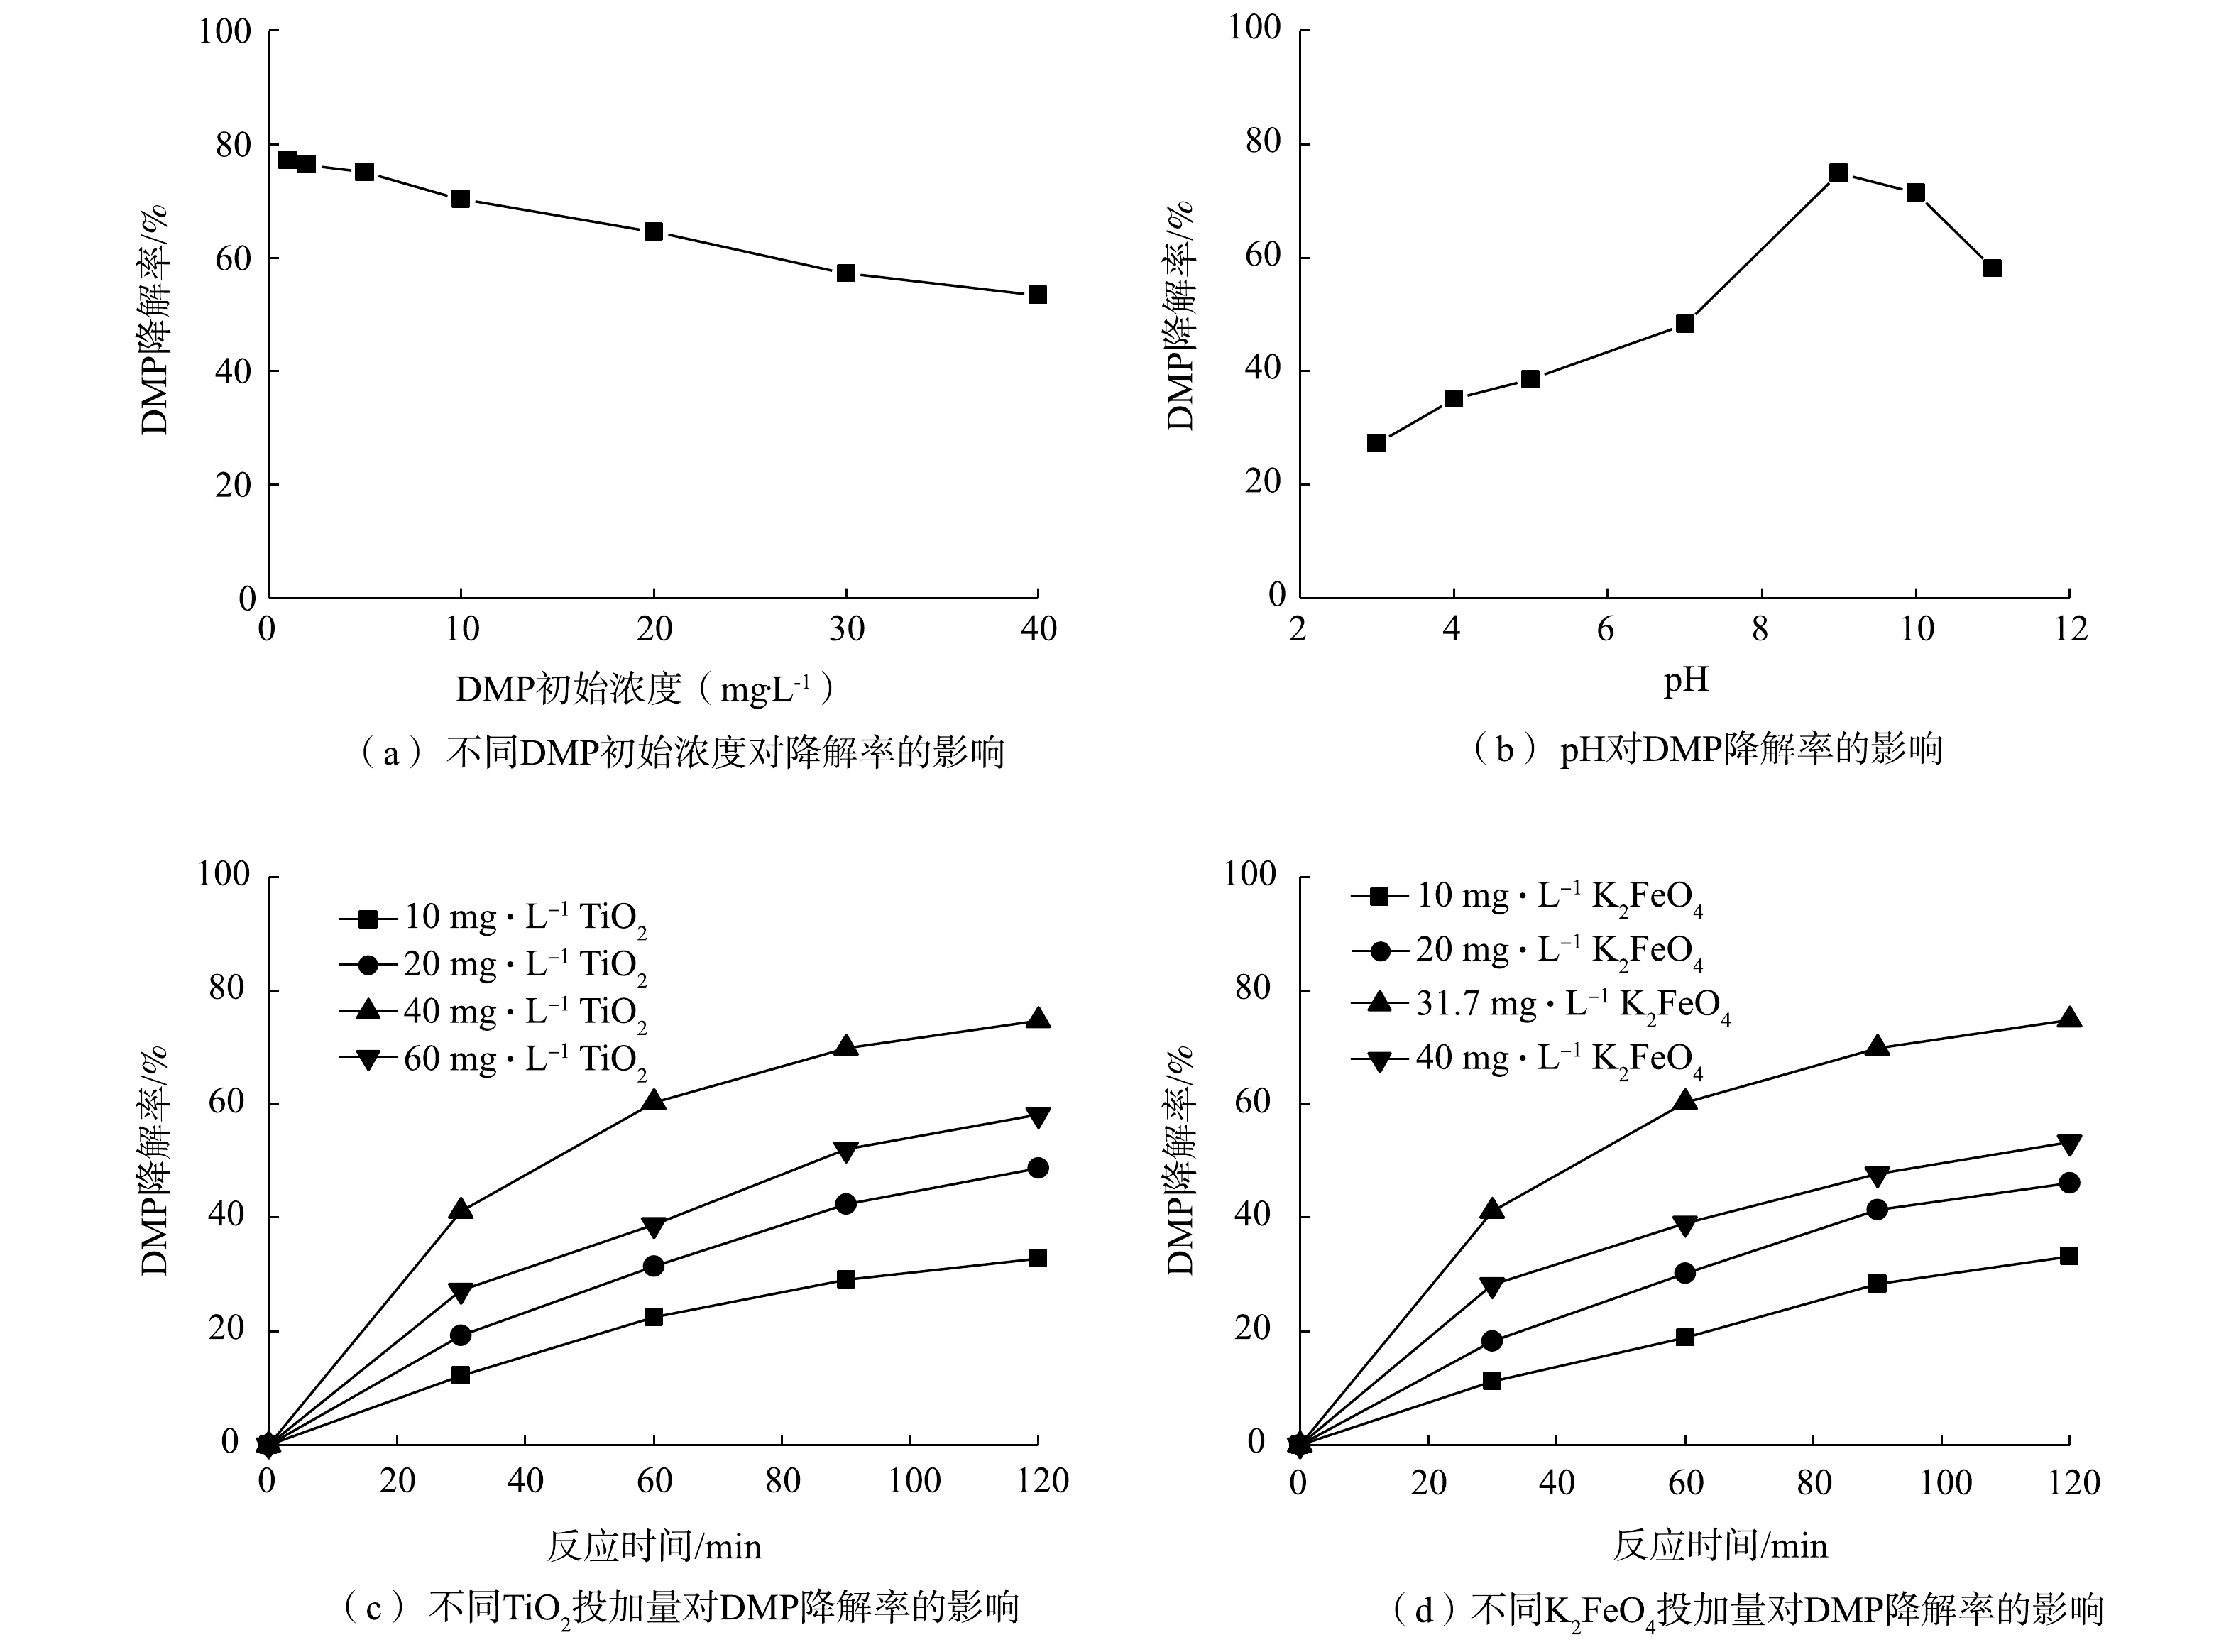
图 2 不同因素对DMP降解率的影响
Figure 2. Effect of different factors on the degradation rate of DMP
-

图 3 不同体系对DMP的降解率的对比
Figure 3. Comparison of DMP degradationamong different systems
-
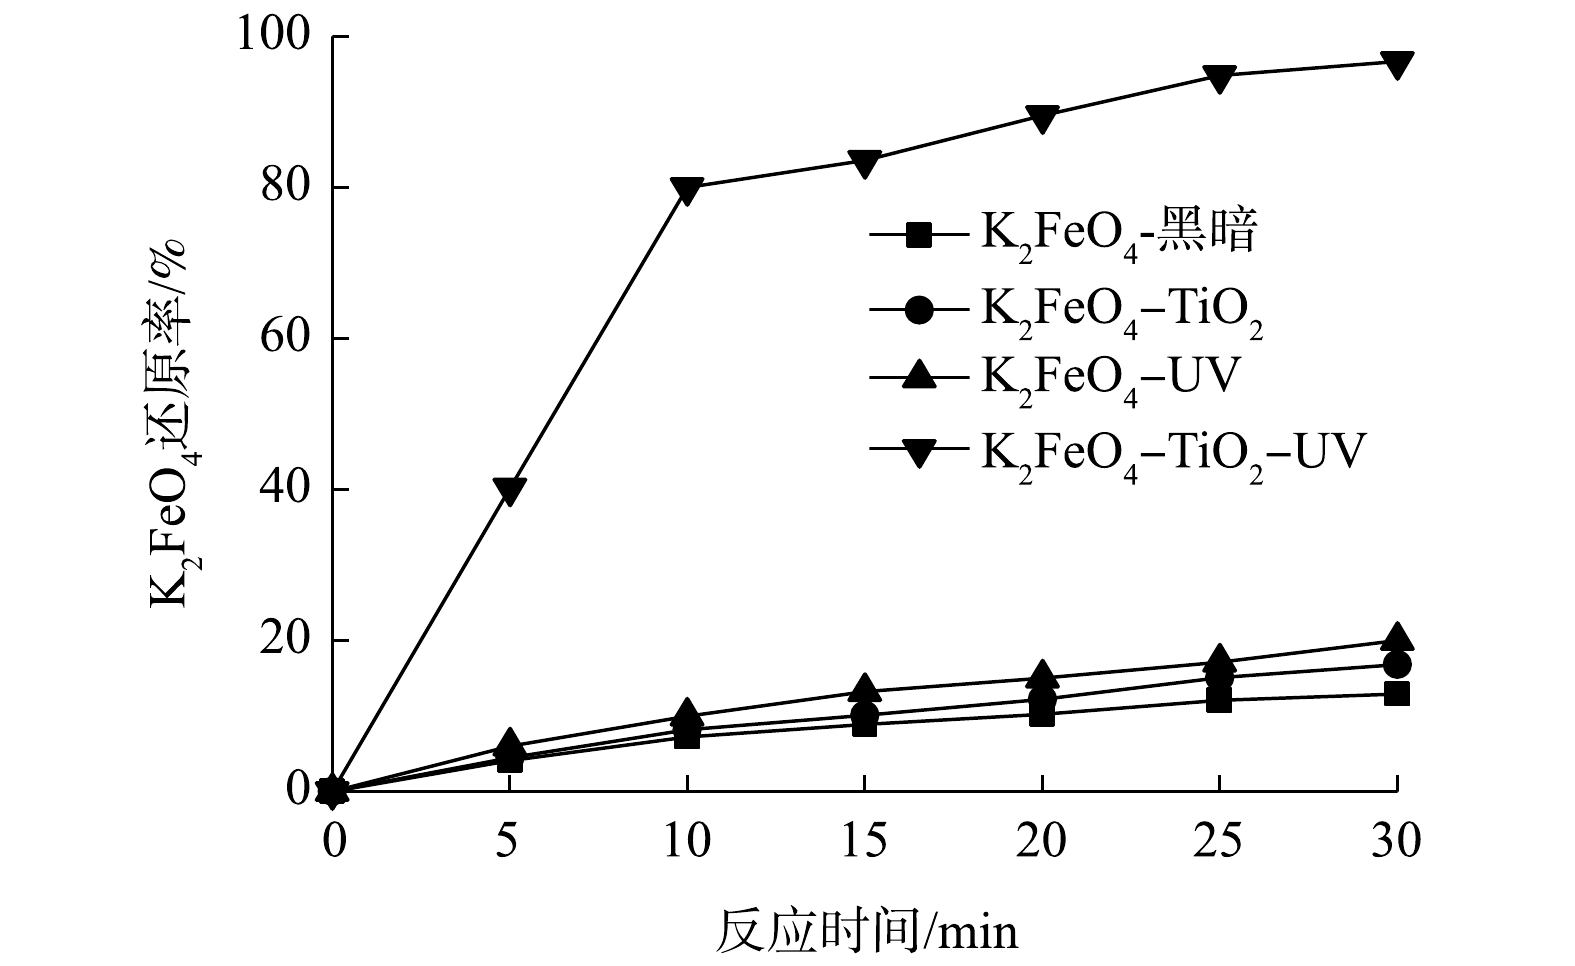
图 4 不同体系对Fe(VI)还原率的对比
Figure 4. Comparison of Fe(VI) reductionamong different systems
-

图 5 不同条件下的TiO2对DMP降解率的影响
Figure 5. Effect of different TiO2 on the degradation rate of DMP
-
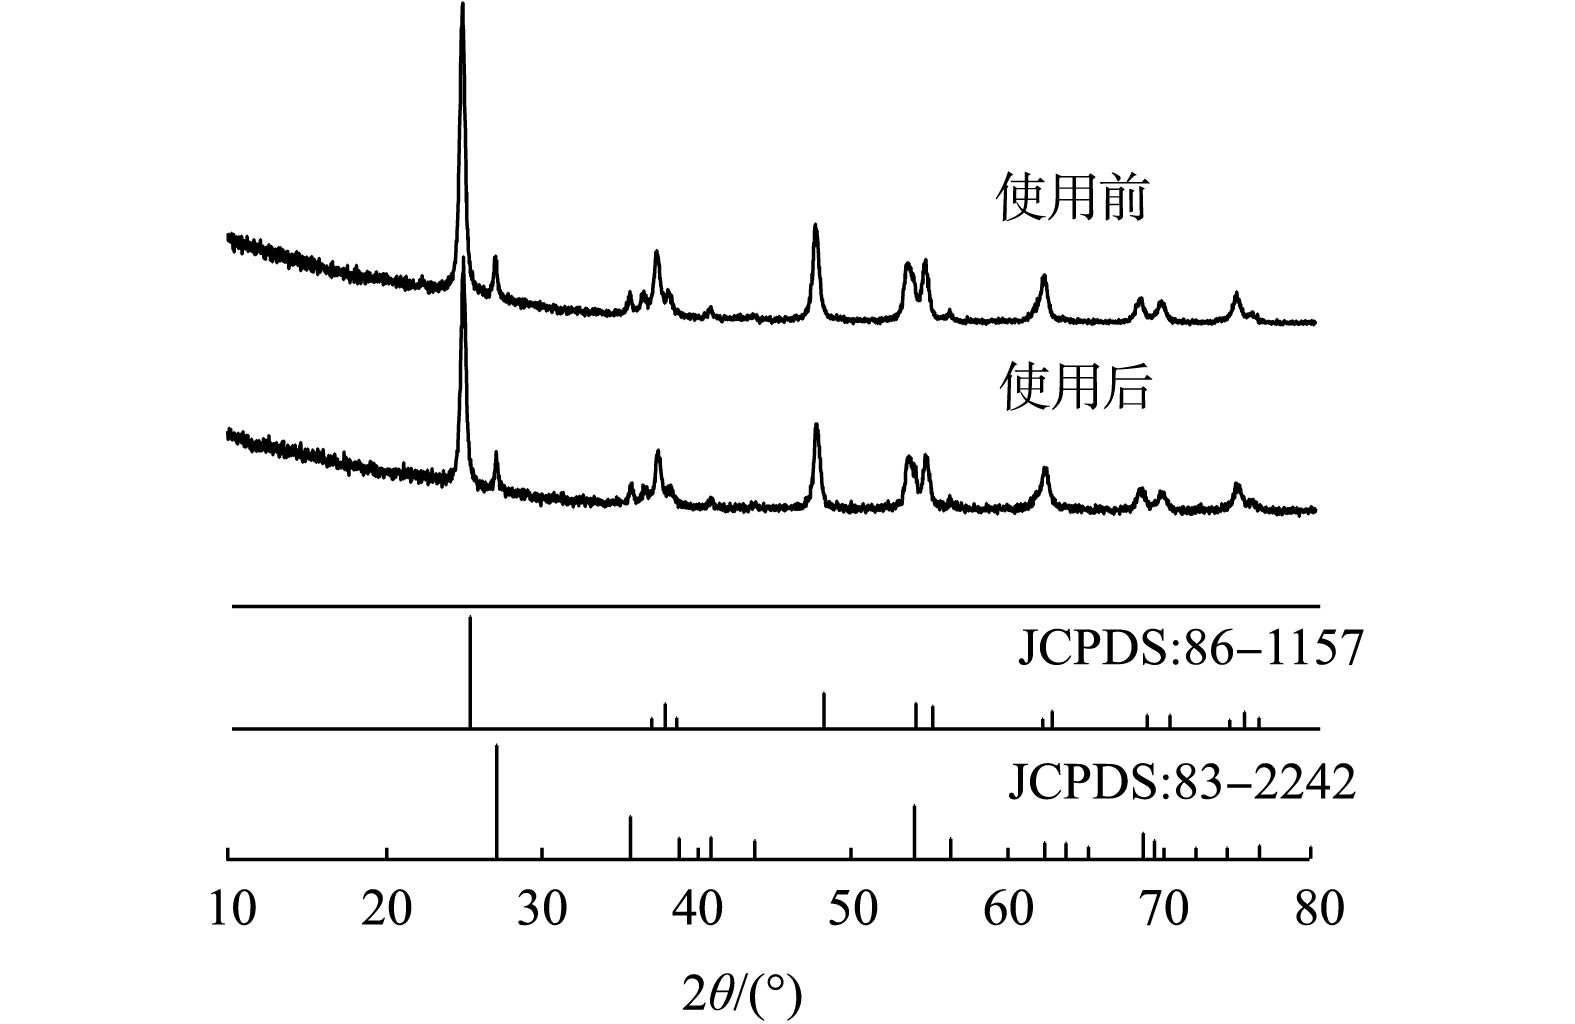
图 6 TiO2催化剂的XRD图谱
Figure 6. XRD patterns of the TiO2 catalyst
-
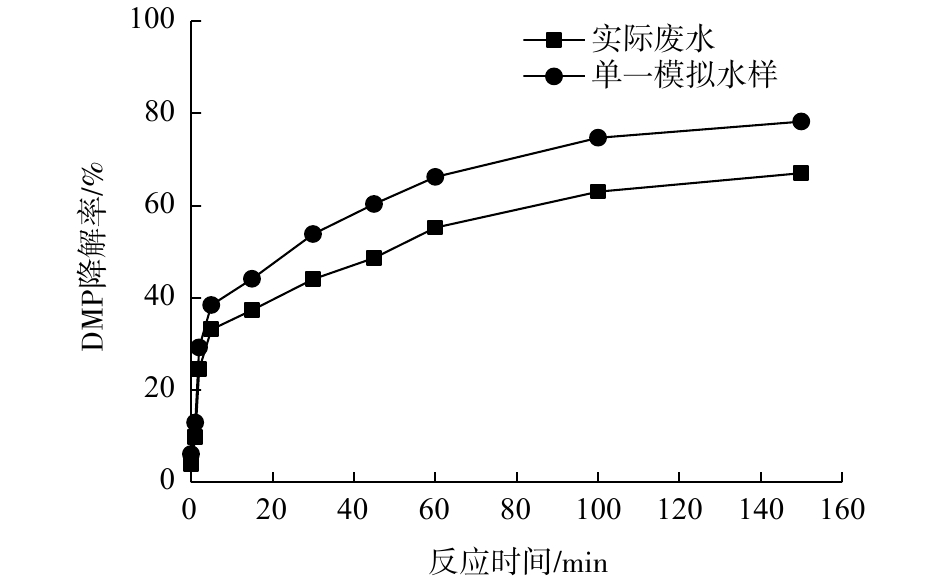
图 7 实际水样与模拟水样中DMP的降解率
Figure 7. Degradation rate of DMP in real water samples and simulated water samples
-
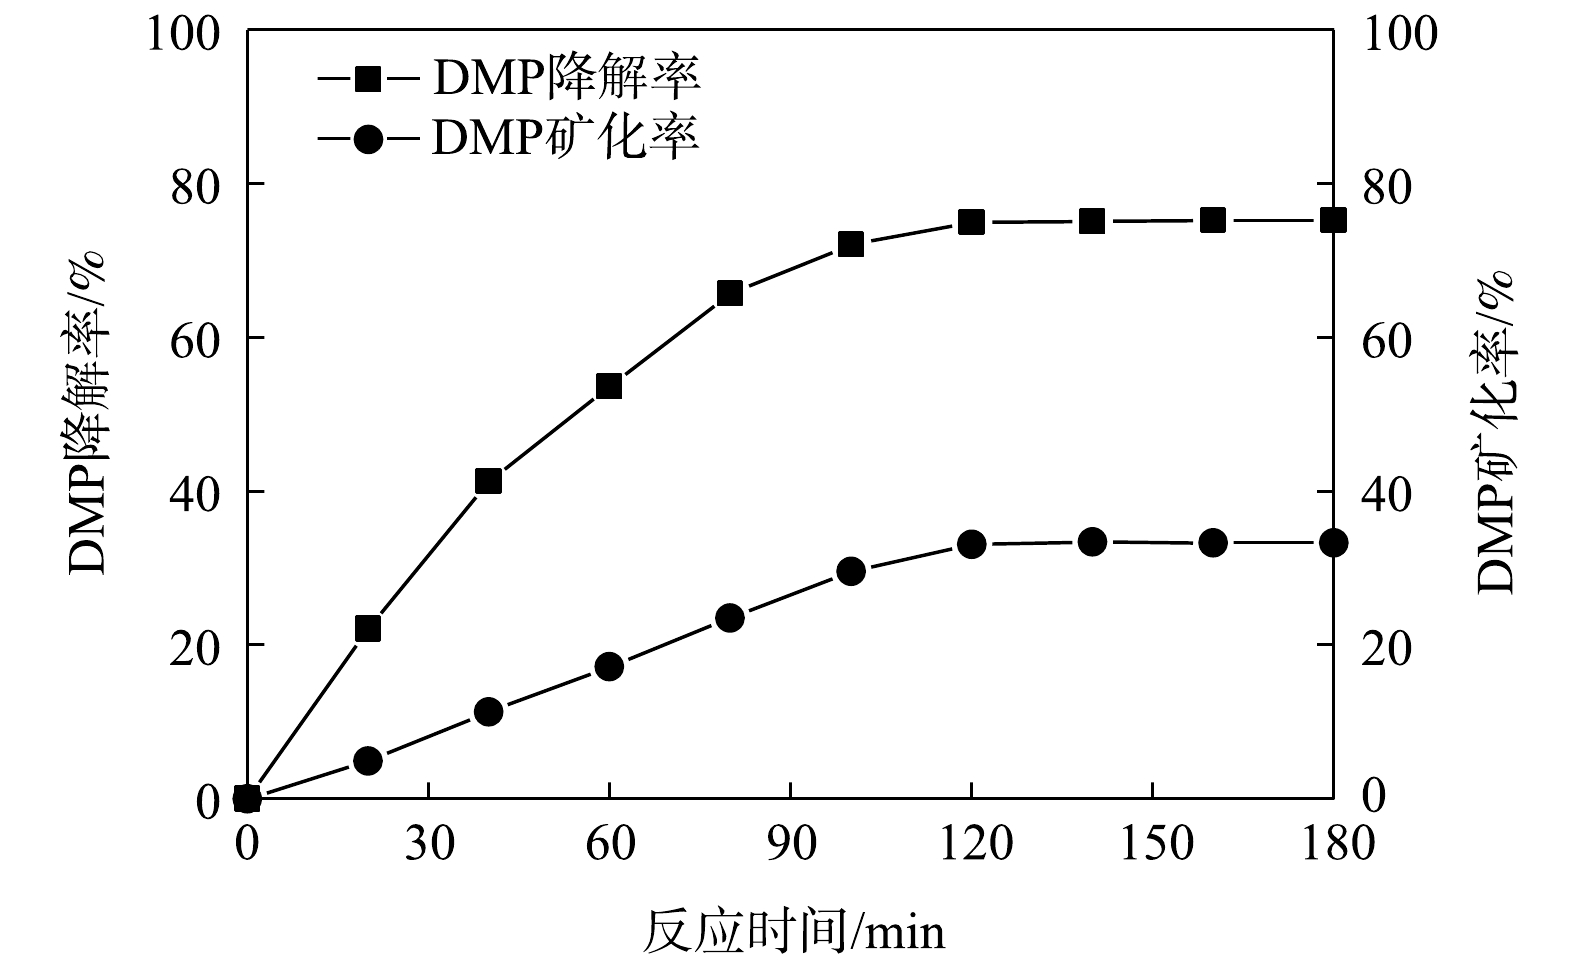
图 8 DMP的光催化降解率和矿化率
Figure 8. Photocatalytic degradation rate andmineralization rate of DMP
-

图 9 DMP降解过程的GC-MS图
Figure 9. GC-MS spectra along the DMP degradation process
-
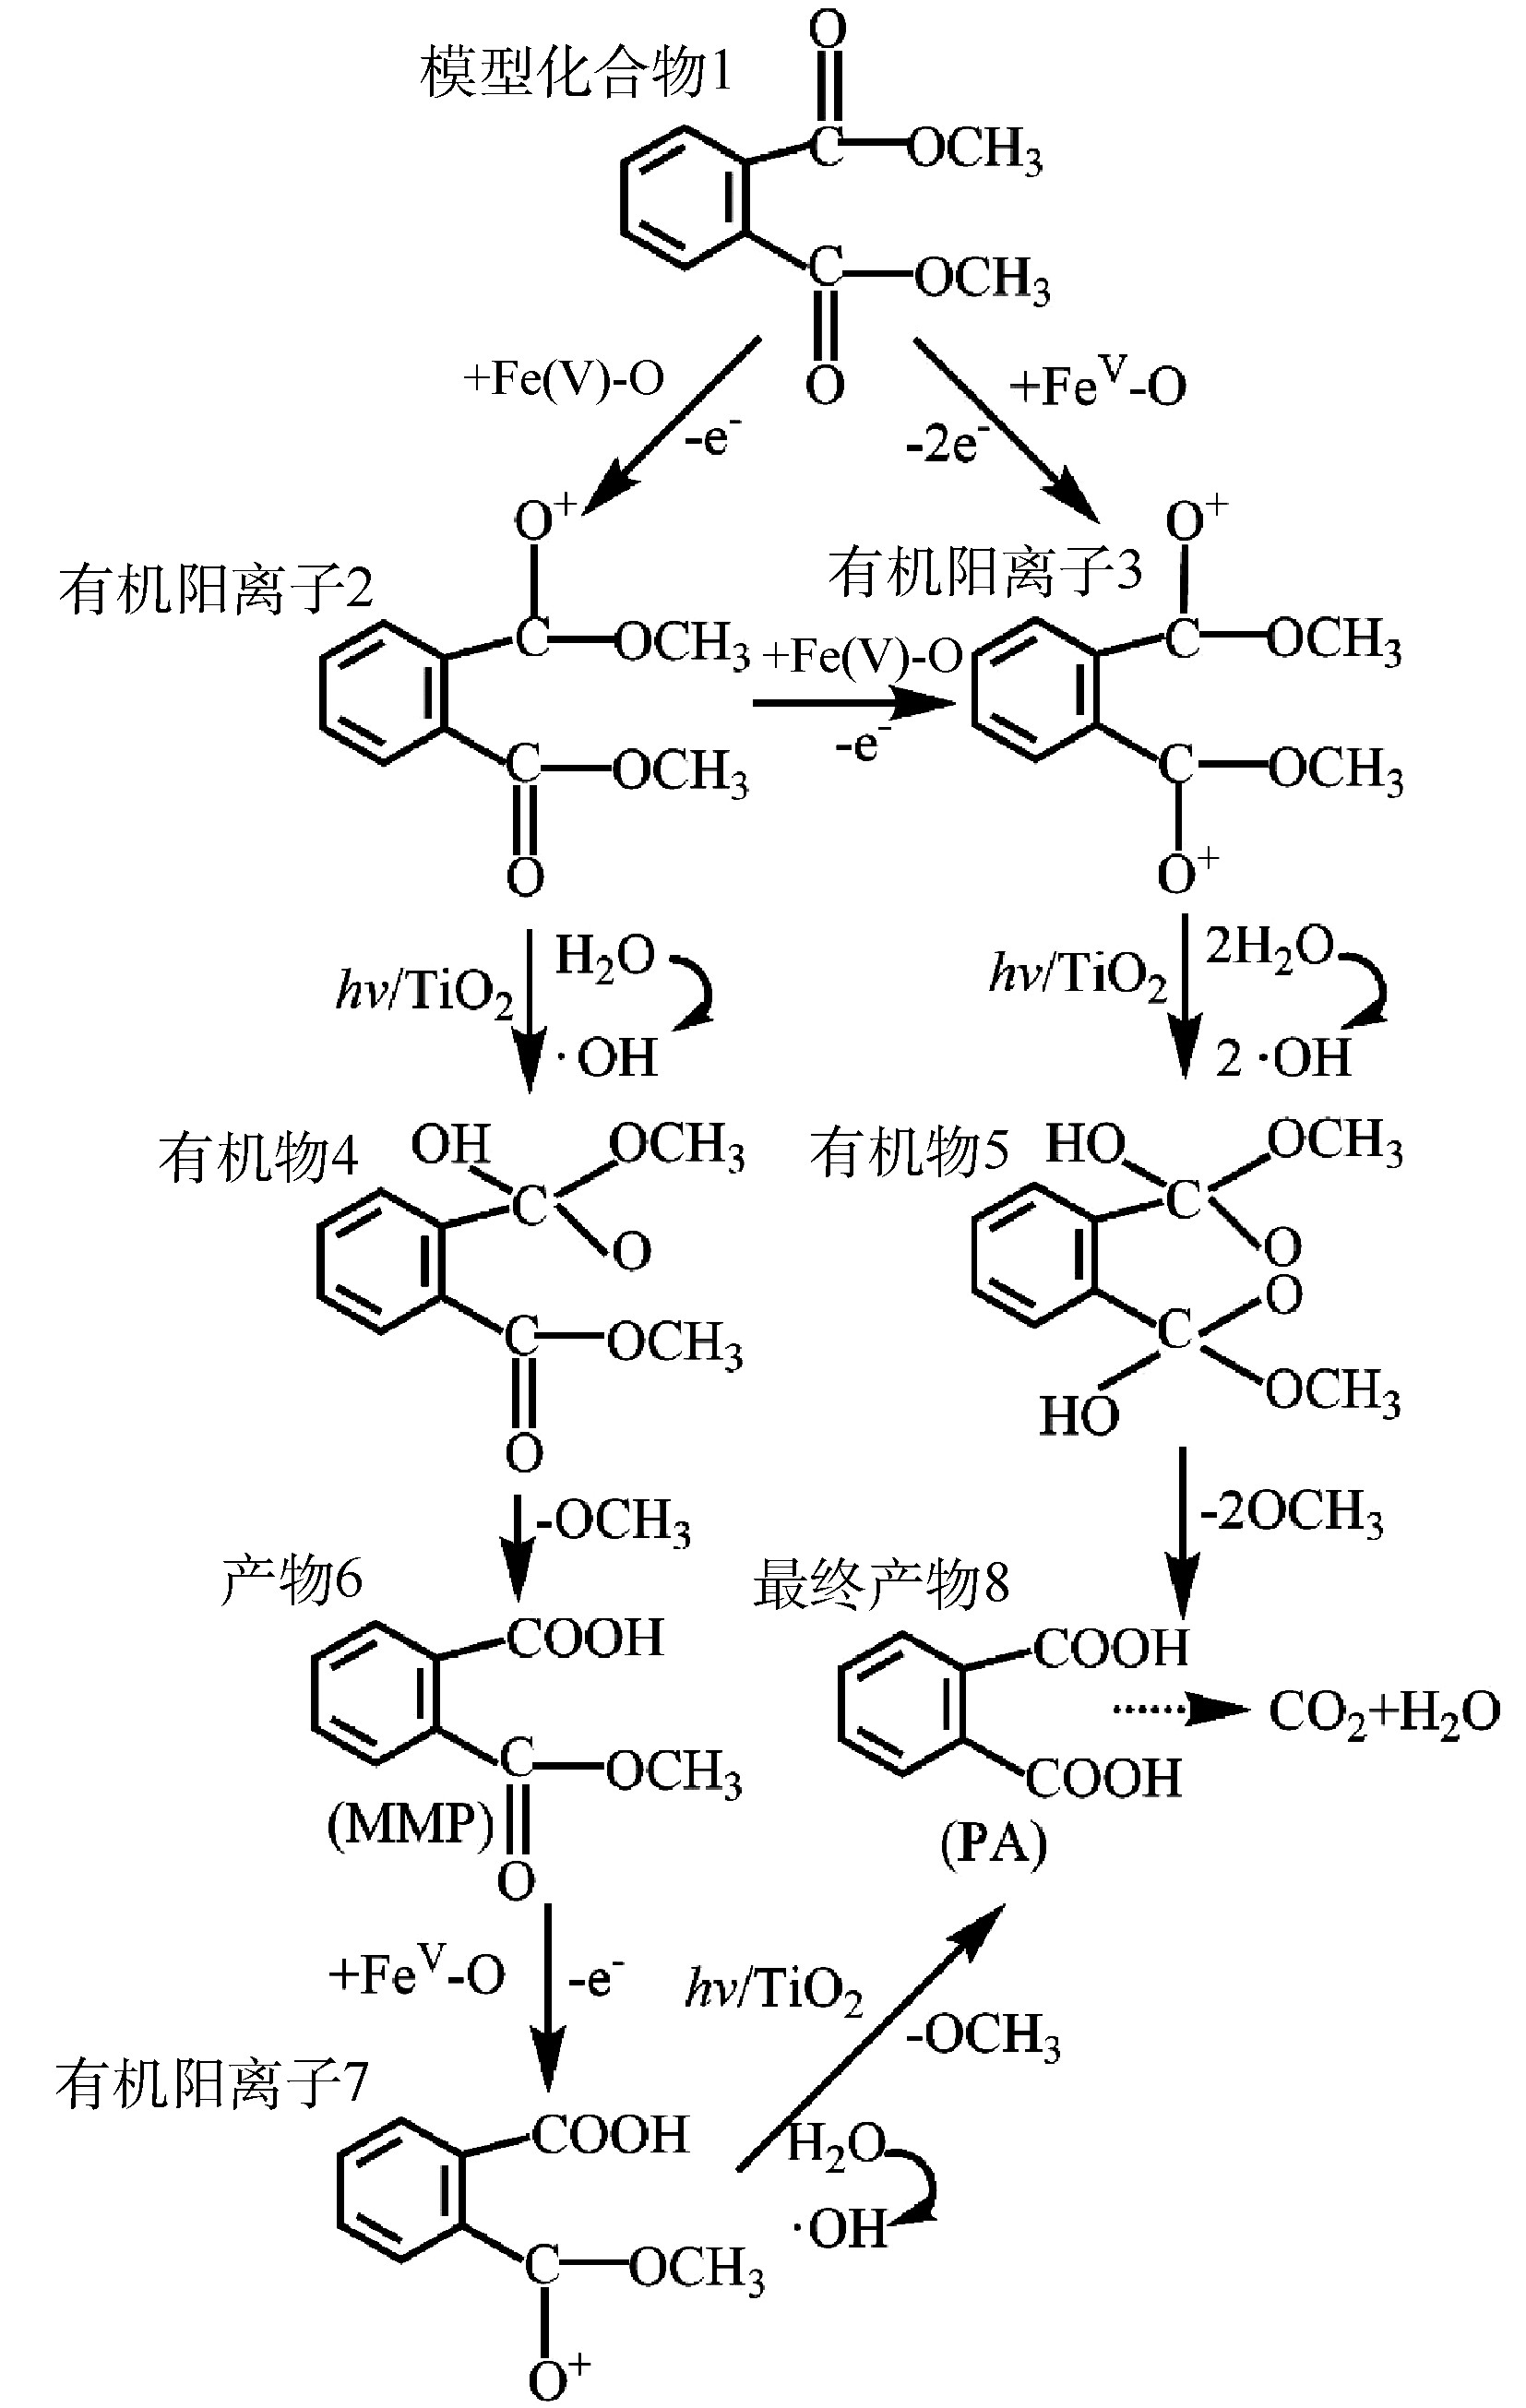
图 10 DMP光催化降解路径
Figure 10. Pathway of DMP photocatalytic degradation
Figure
10 ,Table
0 个