-

图 1 采集及测试位点示意图
Figure 1. Schematic diagram of sites for sampling and testing in Orbal oxidation ditch
-

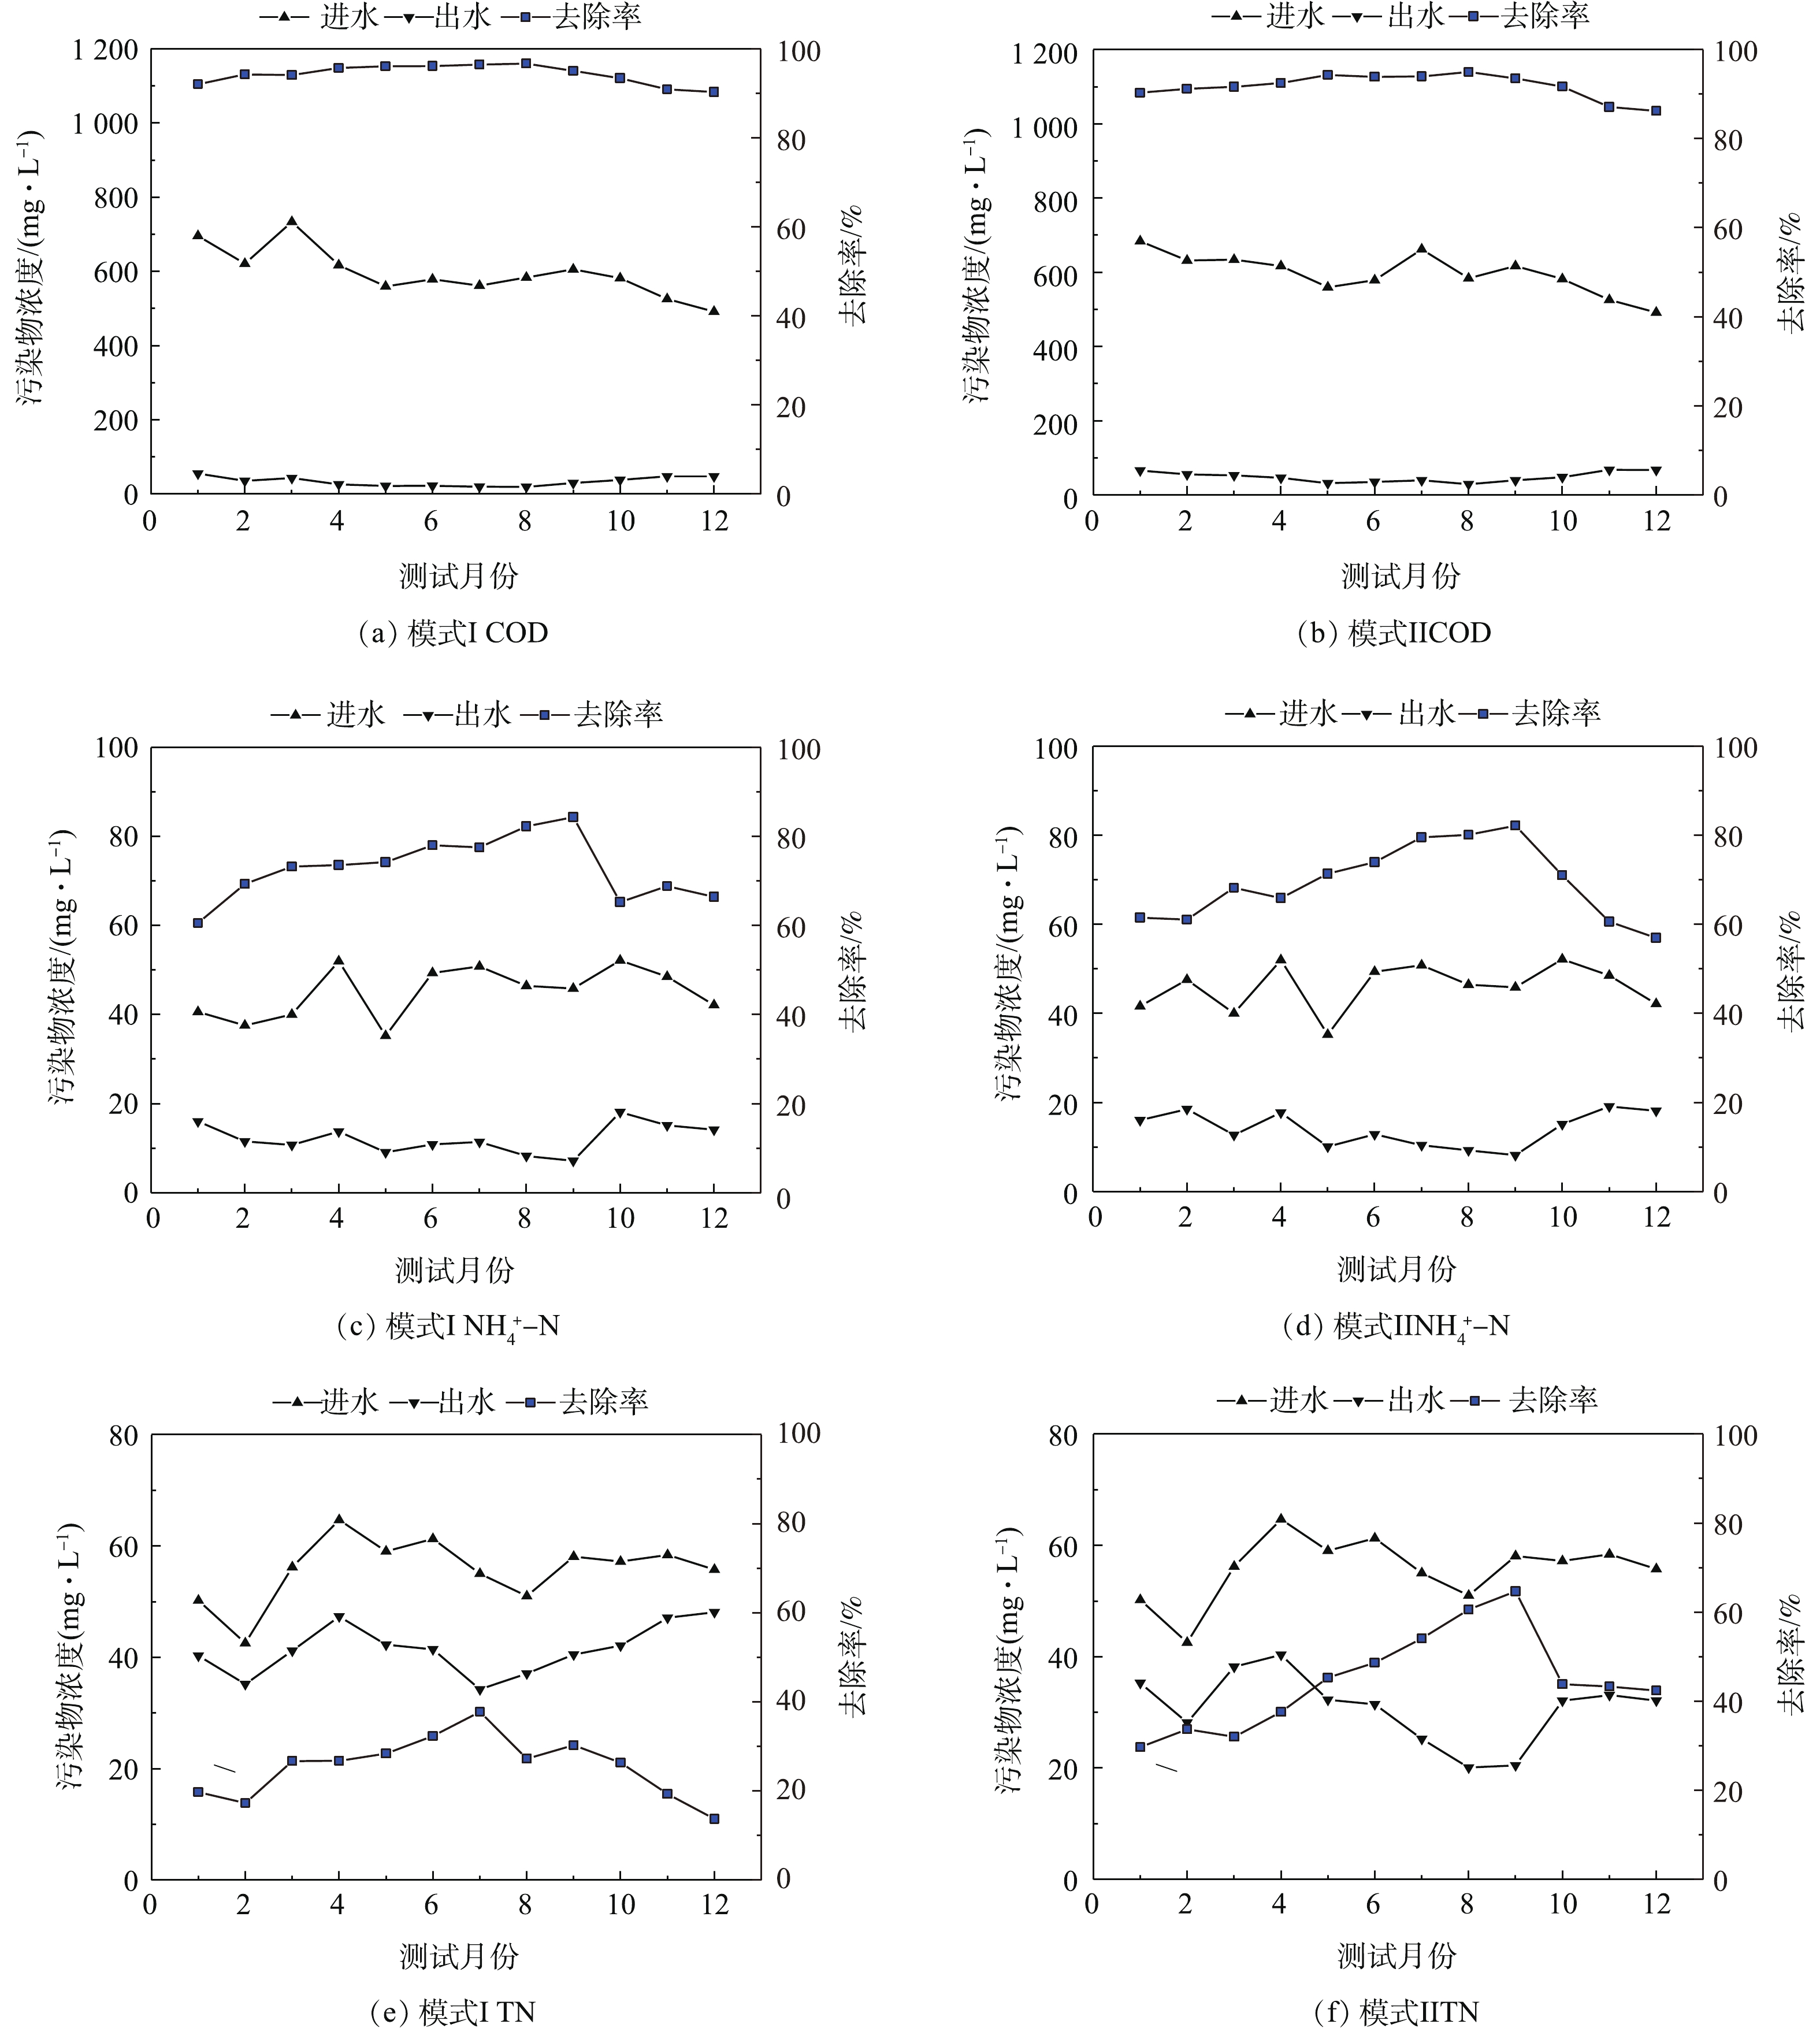
图 2 2种模式下污水处理厂COD、
NH+4 -N和TN的去除率Figure 2. Removal efficiencies of COD,
NH+4 -N and TN under two modes -

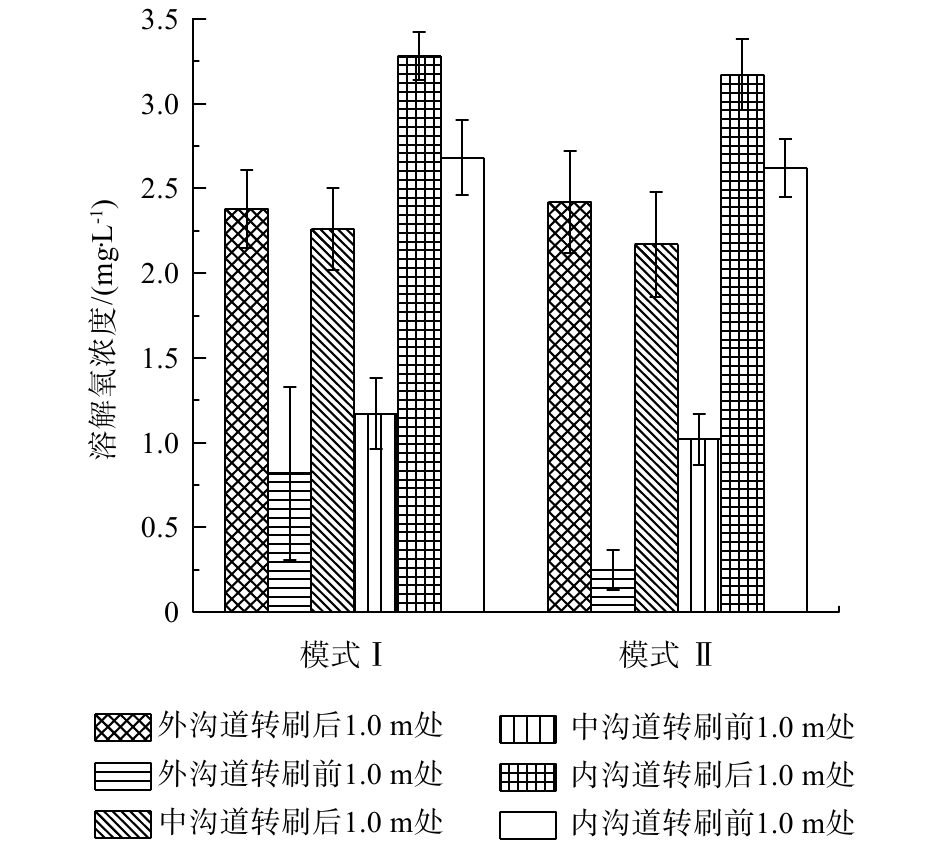
图 3 2种模式下不同沟道转刷前后溶解氧浓度变化
Figure 3. Variation of DO concentration before and after RB in different channels under two modes
-

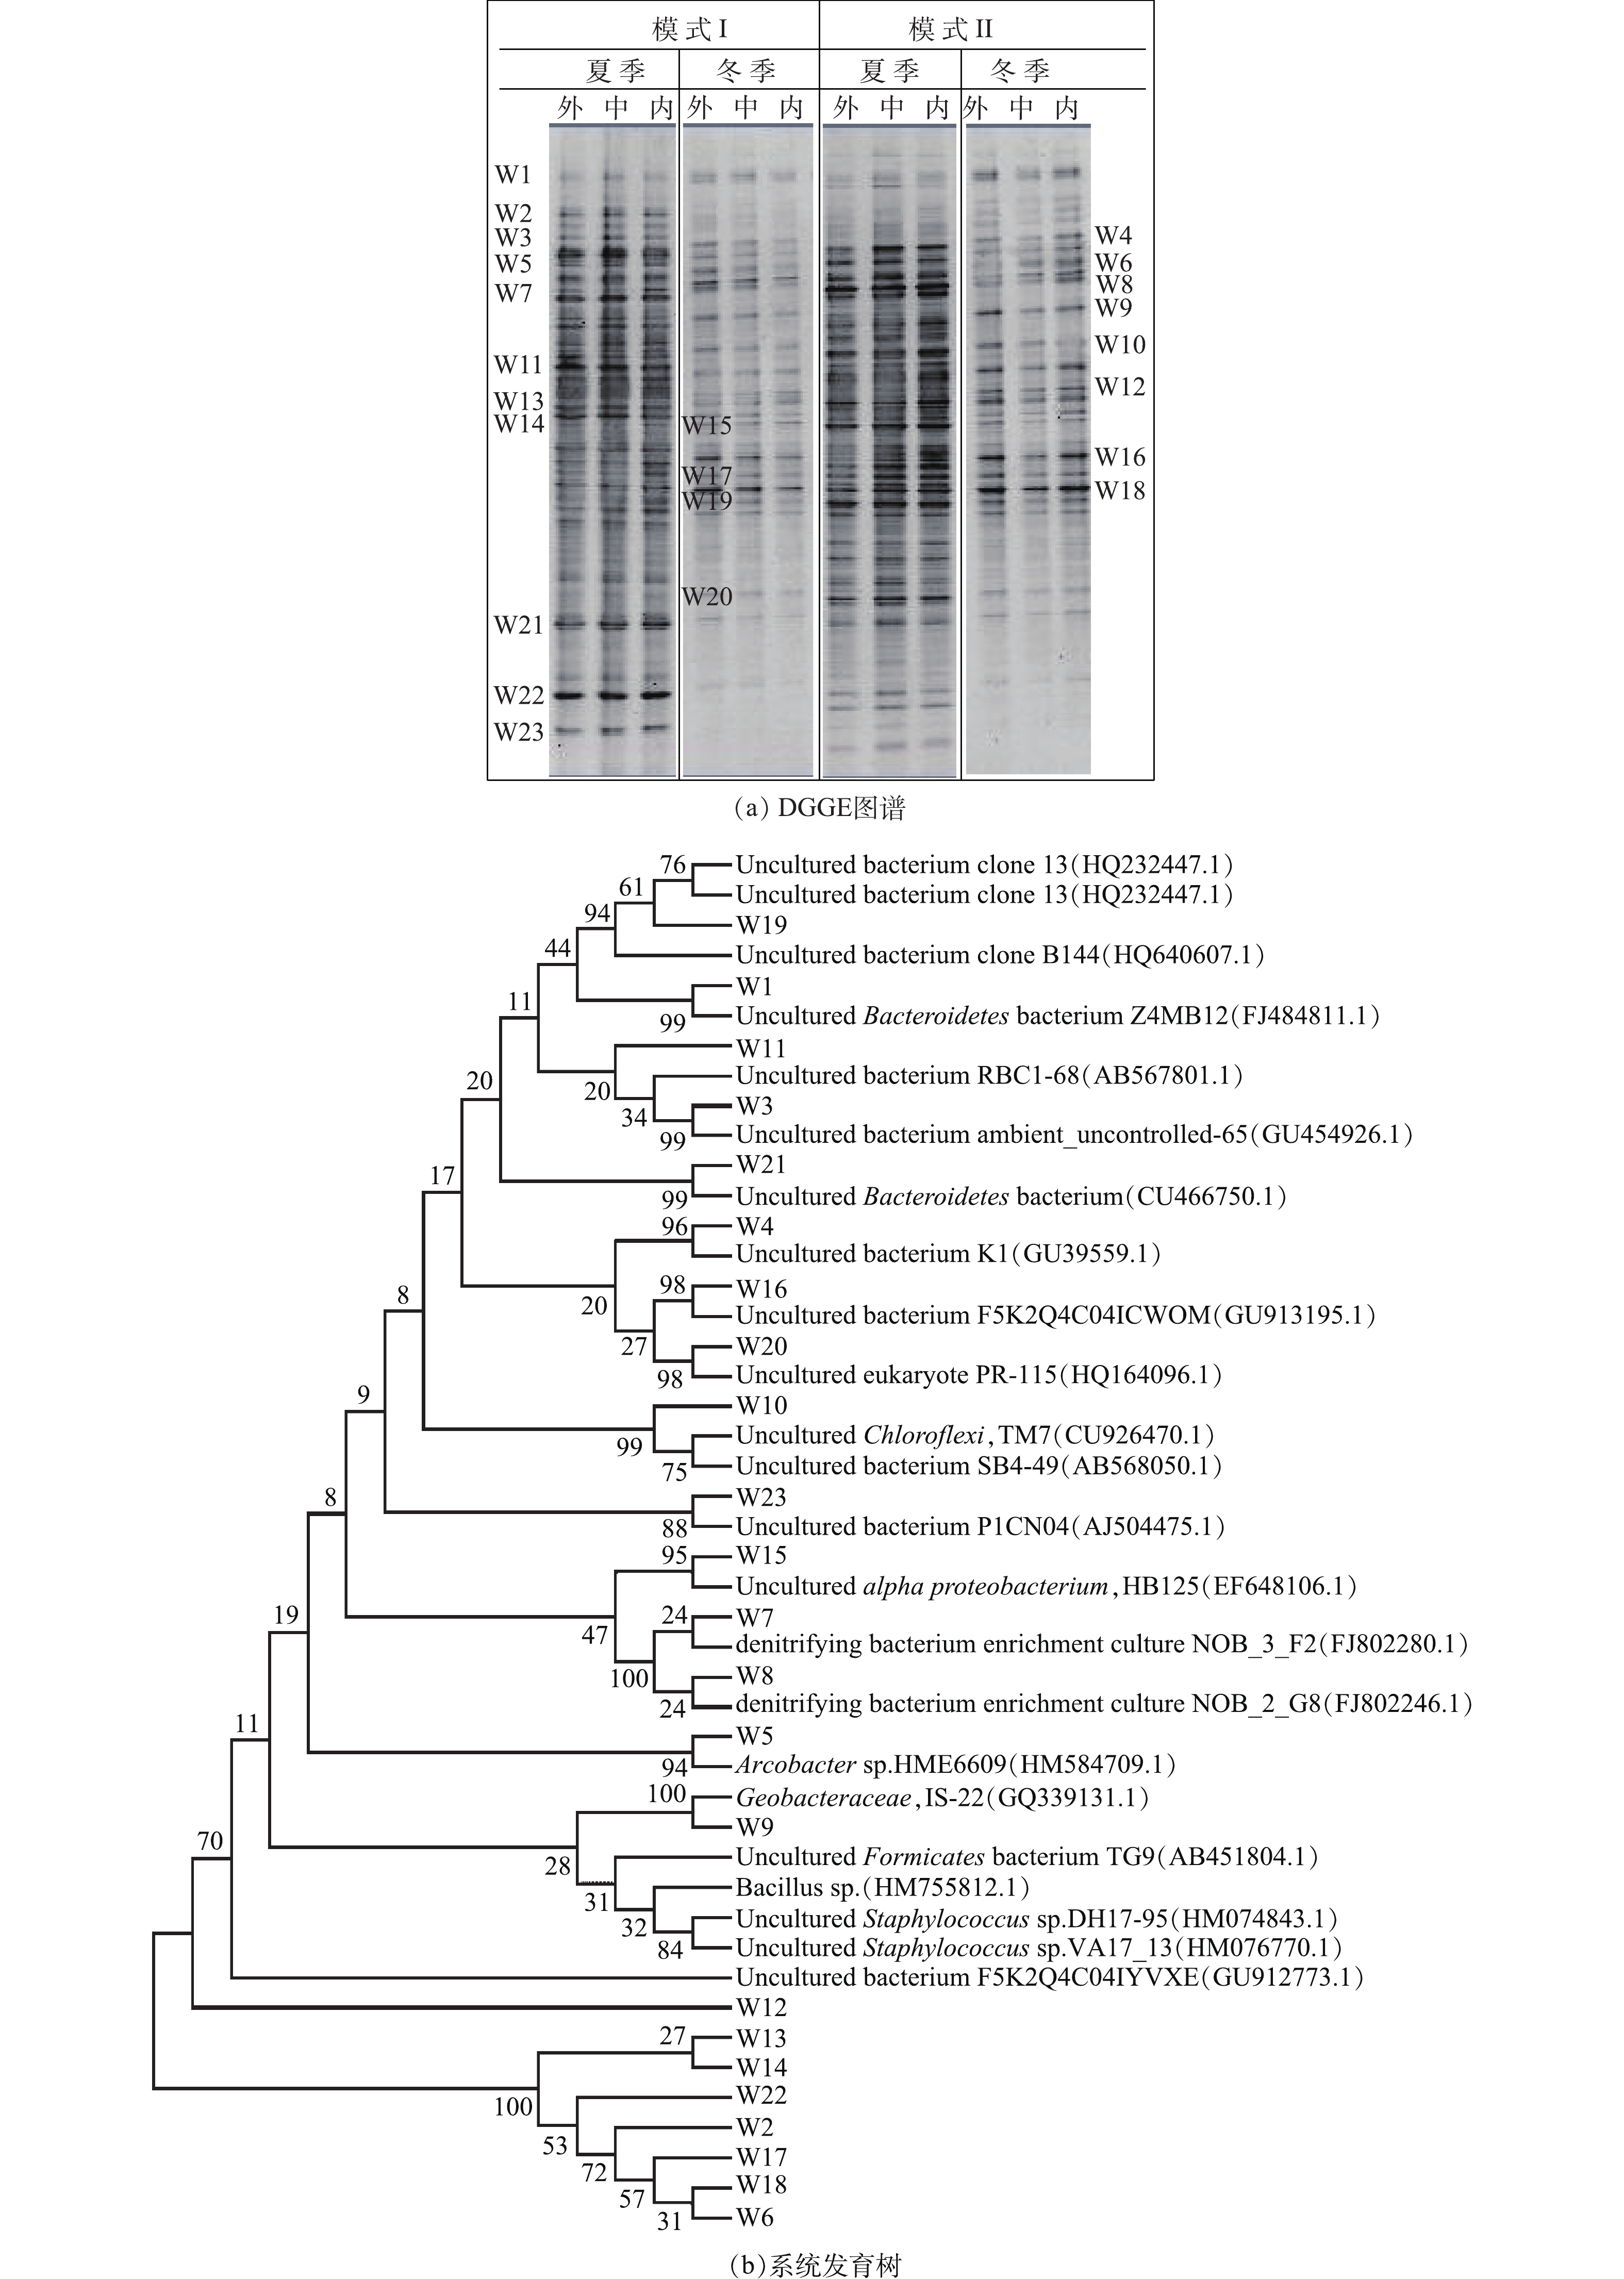
图 4 不同沟道活性污泥中细菌种群
Figure 4. Bacterial population of activated sludge in different channels
-

图 5 2种模式下不同沟道内总细菌、AOB和NOB的含量
Figure 5. Quantity of total bacteria, AOB and NOB in different channels under two modes
-

图 6 HAO、NR活性与
NH+4 -N,TN去除率之间的关系Figure 6. Relationship between HAO and NR activities and removal rates of
NH+4 -N and TN
Figure
6 ,Table
1 个