


全文HTML
随着城镇化的快速发展,污水处理厂建设的不断增加,大量工业、生活污水经过污水处理厂处理后排入周边水体[1]。目前,我国大部分污水处理厂尾水都实现了达标排放,但是仍存在部分污水处理厂尾水不达标的问题,这些未达标尾水含有一定量的氮磷等营养元素[2],排放到河流、湖泊等水体后增加氮磷负荷,造成水体富营养化,带来严重的环境问题[3]。
水生植物净化污水具有环保生态、经济高效的特点,被认为是传统水体修复的替代措施之一[4]。近年来利用水生植物净化污水的研究得到了广泛的关注。植物可以通过不同途径直接或间接地达到去除水体营养盐的目的。研究[5]认为植物在人工湿地中主要起着以下作用:直接吸收利用污水中可利用态的营养物质、吸附和富集重金属和有毒有害物质,错综复杂的根系为微生物吸附生长提供更大的表面积[6-7],植物对氧具有输送、释放和扩散作用,可以将氧输送到根部周围的区域,在根部形成好氧厌氧区域,为根区好氧微生物输送氧气[8-10]。不同植物对水体营养盐去除效果不同。徐寸发等[11]研究了水葫芦、轮叶黑藻和香蒲对滇池富营养化水体的改善效果,水葫芦对总氮的去除率最高(86.87%),轮叶黑藻去除率最低(78.58%),张瑞斌[12]研究认为挺水植物旱伞草和沉水植物金鱼藻的综合净化效能较强。生物量也是影响植物净化效果的重要因素,吴建强等[13]认为不同植物对氮磷的吸收能力主要受生物量的差异影响,刘福兴等[14]研究发现生态浮床总覆盖度越高,去除效果越好;但是关于生物量对净化效果影响的研究结果存在差异,CHEN等[15]对2种不同种植密度的宽叶香蒲的净化效果进行研究,发现植物密度对总氮的净化效果无显著影响;宋超等[16]研究发现,过高的种植密度反而不会带来明显的净化效果,因此,关于生物量对净化效果的影响仍需要进一步的研究。
创设合适的水体环境有利于氮磷等营养物质物质的去除,不同类型植物对水体环境的影响存在差异[17-19],生物量也会影响水体环境;因此,对不同类型植物和生物量进行研究,根据不同类型植物和生物量对水体环境的影响,筛选有利于污染物去除的植物,可以为处理污水处理厂尾水等低污染水体、进一步削减氮磷负荷提供理论依据。
1 材料与方法
1.1 材料
实验选取3种不同植物,分别为粉绿狐尾藻、空心菜和苦草净化污水处理厂模拟尾水。粉绿狐尾藻采自南京师范大学仙林校区三用河(32°06'09.20″N,118°54'30.35″E)。空心菜通过购买幼苗在温室内置于尼龙网上进行水培15 d。苦草采用室内培育,选择大小相似的植株进行培养。实验基质选取太湖淤泥,采回后充分混匀,保持每个实验组添加的淤泥相同,排除底泥中营养盐对水生植物净化效果的影响。实验水体根据前期对江苏省宜兴市周铁镇污水处理厂尾水氮磷浓度的监测模拟配制而成。
1.2 实验处理
实验采用高63 cm,桶口直径50 cm的PVC桶。每个塑料桶水的体积为80 L,底层铺设5 cm左右的淤泥,实验模拟的尾水配置方法为:硝氮用KNO3配制,称取4.62 g,氨氮用NH4Cl配制,称取0.62 g,总磷用KH2PO4配制,称取0.35 g,溶解后倒入80 L的水中,浓度如表1所示。3种水生植物用自来水驯化2周后,选取生长旺盛、大小相似的植株进行尾水净化实验。每个植物设4个生物量水平处理组(表2),每种植物生物量均按照质量比为1:2:3:4进行配置。每个处理重复3次,定期用自来水补充蒸发水量以保证体积恒定。实验在南京师范大学生态修复平台温室内进行,实验从2017年6月7日至7月6日,平均温度为27 ℃。
表1 污水处理厂模拟尾水初始氮磷浓度
Table 1 Initial nitrogen and phosphorous concentrations in simulated tail water of wastewater treatment plant mg·L−1
Table 1 Initial nitrogen and phosphorous concentrations in simulated tail water of wastewater treatment plant mg·L−1
总氮 | 总磷 | 氨氮 | 硝氮 |
8.36±0.71 | 1.17±0.12 | 2.17±0.30 | 6.19±0.41 |
表2 3种水生植物初始生物量
Table 2 Initial biomasses of three species of aquatic plants g
Table 2 Initial biomasses of three species of aquatic plants g
处理 | 空心菜 | 苦草 | 粉绿狐尾藻 |
生物量(B1) | 157.50 | 153.60 | 280.00 |
生物量(B2) | 320.00 | 307.20 | 590.00 |
生物量(B3) | 470.00 | 460.80 | 820.00 |
生物量(B4) | 630.00 | 609.40 | 1 120.00 |
空白(C) | — | — | — |
1.3 取样与测试
实验期内采样8次,在实验的第0、2、5、10、15、20、25、30天采集水样,测定总氮、总磷、氨氮、硝氮、亚硝氮、DO、pH,同时测定植物生物量等指标。生物量的测定方法是将水生植物从实验桶中取出,用吸水纸吸干水分后称重。如遇有水生植物破败、死亡情况,及时捞出,不计入生物量。总氮用碱性过硫酸钾消解紫外分光光度法(GB 11894-1989)测定,总磷用钼酸铵分光光度法(GB 11893-1989)测定,硝态氮用Auto Analyzer 3 连续流动分析仪(德国Bran Luebbe公司)测定;DO和pH用美国HACH生产的HQ30d便携式溶氧、pH测试仪进行测定。采用Excel 2016统计数据,Origin 9.0软件绘制图表,采用SPSS17.0软件对实验数据进行相关性分析,采用Two-way ANOVA进行方差分析。
2 结果与分析
2.1 3种水生植物的生长特征
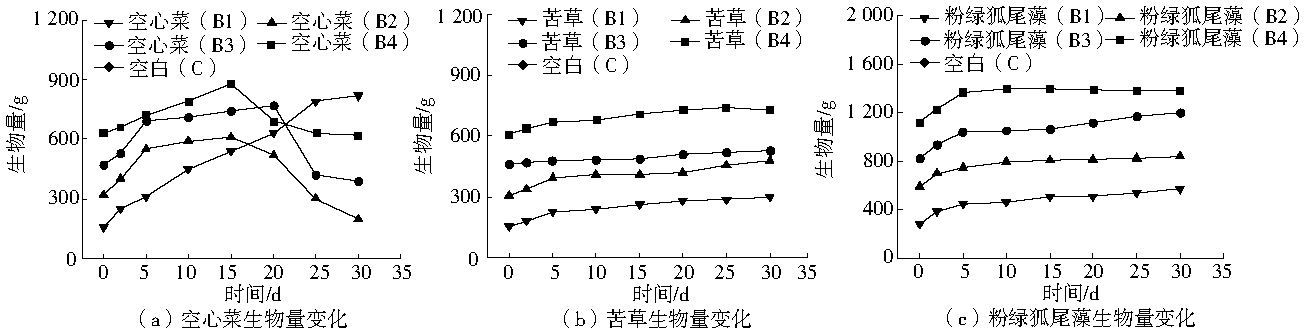
各组植物均表现出初期生物量增加较快,后期增加有所放缓。苦草和粉绿狐尾藻生物量随时间呈不断增加趋势。空心菜处理组生物量初期上升速度较快,叶片快速生长,在实验第15天,空心菜各生物量处理组(B1~B4)分别增加了3.6、1.9、1.5、1.4倍,高生物量处理组在实验初期便覆盖了整个生长区域,但是生物量达到峰值后,开始不断下降,可能是生物量限制了植物的生长,造成植物叶片衰亡,长势减弱(图1)。空心菜(B1)处理组在实验周期内持续生长,但是后期长势减缓,说明其生长也受到了生物量的影响。苦草生物量在实验周期内叶长和生物量持续增加,但是增加量较小,可能是苦草经过前期培养,逐渐达到生长稳定期。高粉绿狐尾藻生物量处理组随着时间增加,生物量达到了4种水生植物全生长周期的最大生物量,为1 398.20 g。
图1 3种水生植物生物量变化
Fig. 1 Biomass variations of three species of aquatic plants
Fig. 1 Biomass variations of three species of aquatic plants
2.2 3种水生植物对尾水溶解氧和pH的影响
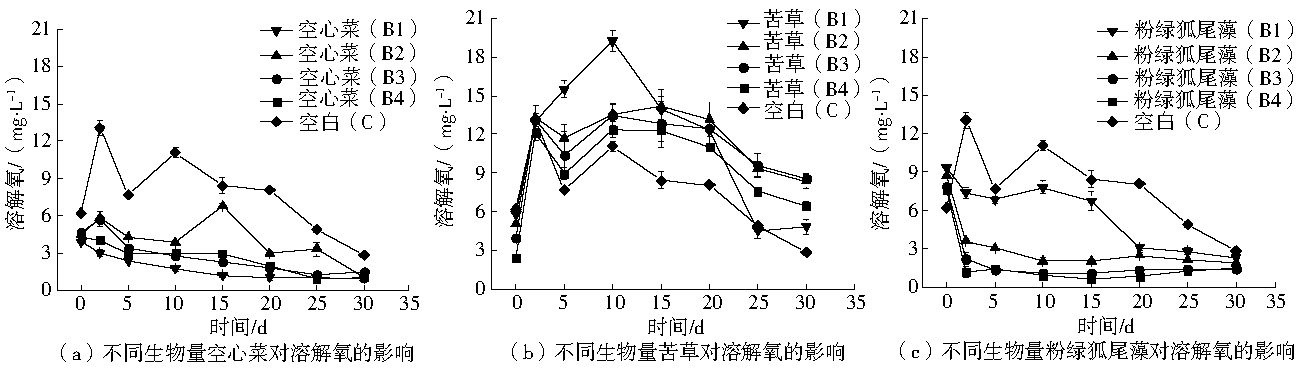
不同植物对水体溶解氧含量影响存在差异,苦草、粉绿狐尾藻、空心菜3种水生植物水体DO平均值分别为10.47、3.30和2.89 mg·L−1。苦草水体DO浓度最高,空心菜水体DO最低。苦草可以显著提高水体溶解氧含量,其他2种植物由于覆盖在水面,DO含量显著低于苦草水体。苦草DO初期增加较快,由6 mg·L−1快速增加10 mg·L−1以上,而另外2种植物DO则随时间不断下降(图2)。生物量对水体DO浓度存在影响,苦草和粉绿狐尾藻DO浓度均随生物量增加,呈下降趋势。空心菜水体DO浓度受植物生长状况影响,不同生物量处理组变化趋势存在差异。最低生物量处理组(B1)在整个净化周期内均呈现上升趋势,植物覆盖度不断增加,到实验结束已基本覆盖全部水面。而其DO随生物量增加,呈现出不断降低的趋势,另外3个空心菜处理组,在实验后期均表现出一定的密度胁迫,植物有所衰败。空白对照在整个实验周期内呈现初期快速上升,后期不断下降,苦草溶解氧基本均大于空白对照,空心菜和粉绿狐尾藻水体DO浓度显著低于空白对照。对溶解氧含量进行方差分析,结果表明,第5、15和30天,水体溶解氧受植物类型影响极显著(P≤0.01),生物量对溶解氧含量影响较小。
图2 不同水生植物和生物量对污水溶解氧含量的影响
Fig. 2 Influence of different aquatic plant types and biomasses on wastewater DO
Fig. 2 Influence of different aquatic plant types and biomasses on wastewater DO
图2 不同水生植物和生物量对污水溶解氧含量的影响
Fig. 2 Influence of different aquatic plant types and biomasses on wastewater DO
Fig. 2 Influence of different aquatic plant types and biomasses on wastewater DO
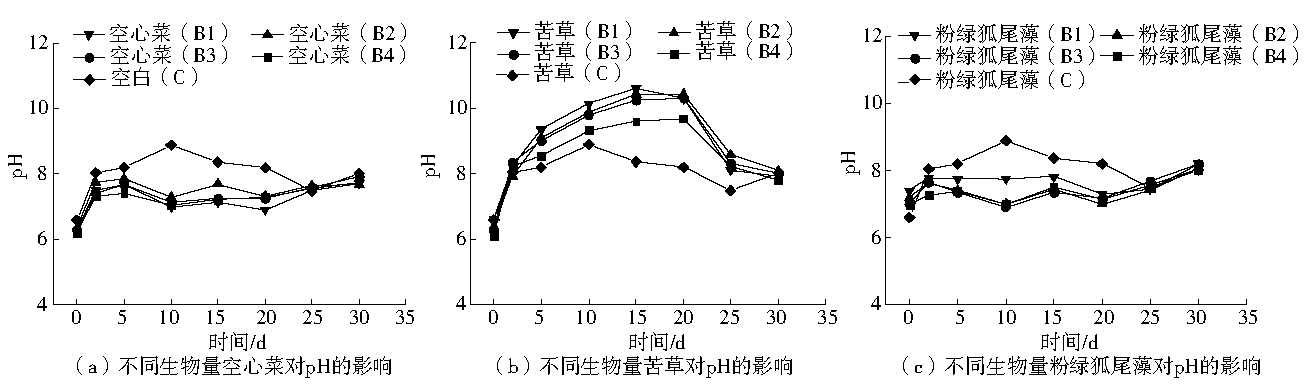
不同植物处理水体pH有所不同,苦草、粉绿狐尾藻、空心菜3种水生植物水体pH平均值分别为8.94、7.46和7.30。pH变化与DO相似,苦草水体pH显著高于其他2种植物。苦草水体pH开始时快速上升,20 d上升到最高,各组pH均高于9.68,粉绿狐尾藻和空心菜水体pH均随时间呈现波动上升的趋势(图3)。水体pH受生物量影响,但整体差异不显著。苦草水体pH随生物量增加呈下降趋势。最高空心菜生物量处理组(B4)在实验初期pH低于最低空心菜生物量处理组(B1),后期高于最低空心菜生物量处理组。空白对照pH呈先升高、后降低的趋势。苦草水体pH大于空白对照,粉绿狐尾藻和空心菜处理组水体均低于空白对照。对pH进行方差分析,结果表明,第5、15和30天,受植物类型影响显著(P≤0.05),生物量对pH影响较小。
图3 不同水生植物和生物量对污水pH的影响
Fig. 3 Influence of different aquatic plant types and biomasses on wastewater pH
Fig. 3 Influence of different aquatic plant types and biomasses on wastewater pH
图3 不同水生植物和生物量对污水pH的影响
Fig. 3 Influence of different aquatic plant types and biomasses on wastewater pH
Fig. 3 Influence of different aquatic plant types and biomasses on wastewater pH
2.3 3种水生植物对氮的去除效果
2.3.1 总氮的去除效果
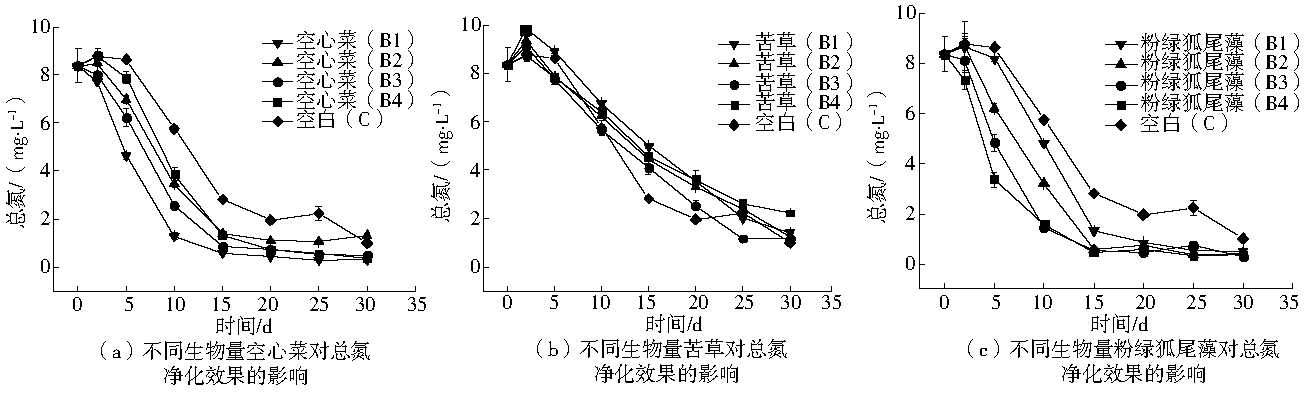
实验结果表明,除苦草外,其他2种水生植物净化效果均高于空白对照。总体上,3种水生植物对TN均具有较好的去除效果。苦草、粉绿狐尾藻、空心菜3种植物对水体TN去除效果存在差异,对水体TN去除率(30 d)平均值分别为95.28%、92.58%和81.98%。粉绿狐尾藻对水体TN净化效果最好,苦草净化效果最差。粉绿狐尾藻和空心菜水体TN在前15 d下降较快,15 d以后,水体TN浓度逐渐达到平衡,之后保持稳定在较低水平(图4)。生物量对植物净化效果存在影响,在第0~15天,粉绿狐尾藻TN浓度与种植密度呈现良好的负相关关系(R=−0.989,P<0.05);第15天后,种植密度对总氮的去除已无明显差异,苦草生物量对TN去除效果影响不显著。空心菜水体TN净化效果受植物生长情况影响,最低生物量处理组(B1)净化效果最好,其他生物量处理组后期出现叶片凋亡,导致净化效果低于最低生物量处理组,各生物量处理组最终净化效果无显著差异。苦草处理组TN在净化周期内持续匀速降低,高生物量处理并未表现出高去除效果。方差分析结果表明,30 d去除效果,受植物类型影响显著(P<0.05),生物量对净化效果影响较小。
图4 不同水生植物和生物量对总氮净化效果的影响
Fig. 4 Influence of different aquatic plant types and biomasses on purification effects of TN
Fig. 4 Influence of different aquatic plant types and biomasses on purification effects of TN
图4 不同水生植物和生物量对总氮净化效果的影响
Fig. 4 Influence of different aquatic plant types and biomasses on purification effects of TN
Fig. 4 Influence of different aquatic plant types and biomasses on purification effects of TN
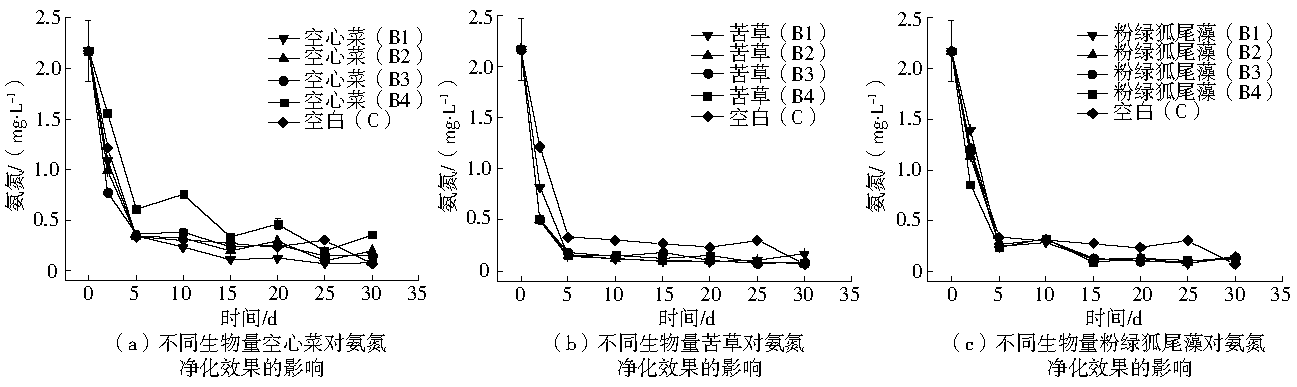
2.3.2 氨氮的去除效果
3种水生植物对氨氮去除效果存在差异,苦草、粉绿狐尾藻、空心菜3种水生植物对水体氨氮去除率平均值(30 d)分别为95.30%、94.10%和91.27%。苦草对水体氨氮净化效果最好,3种植物均表现为前期快速下降,5 d后逐渐稳定(图5)。净化周期内,各生物量处理组净化效果无显著差异。最低空心菜生物量处理组(B1)在10 d后,氨氮降到最低,低于其他生物量处理组,这可能是由植物生长情况变化引起的。实验期间,空白对照水体氨氮下降显著,效果好于空心菜,低于苦草和粉绿狐尾藻。对氨氮去除效果进行方差分析,结果表明,实验初期(5 d),植物类型对氨氮净化效果影响显著(P<0.05),实验末期(30 d),植物类型和生物量对氨氮净化效果影响较小。
图5 不同水生植物和生物量对氨氮净化效果的影响
Fig. 5 Influence of different aquatic plant types and biomasses on purification effects of NH4+-N
Fig. 5 Influence of different aquatic plant types and biomasses on purification effects of NH4+-N
图5 不同水生植物和生物量对氨氮净化效果的影响
Fig. 5 Influence of different aquatic plant types and biomasses on purification effects of NH4+-N
Fig. 5 Influence of different aquatic plant types and biomasses on purification effects of NH4+-N
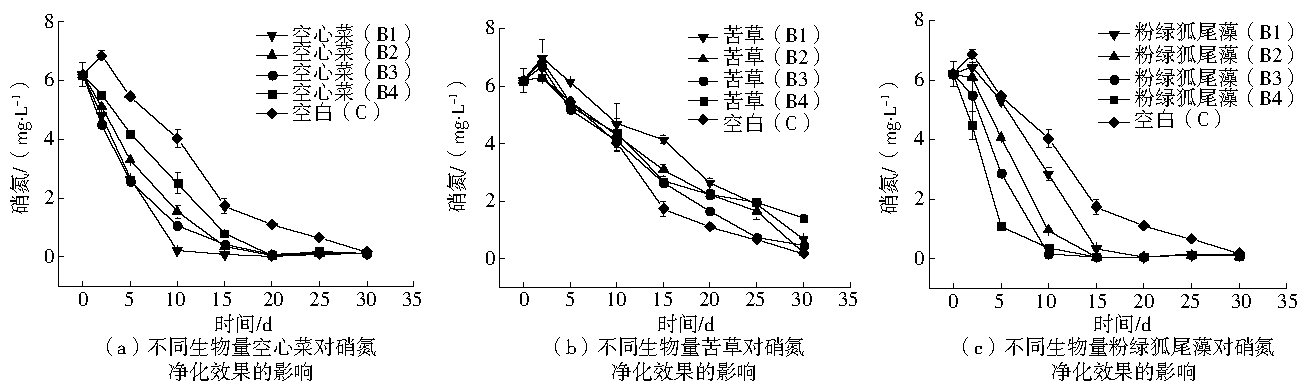
2.3.3 硝氮的去除效果
硝氮的去除效果和总氮具有一致性。3种水生植物对硝氮的去除效果较好。植物对水体硝氮去除效果存在差异,苦草、粉绿狐尾藻、空心菜3种水生植物对水体硝氮去除率(30 d)平均值分别为98.50%、98.13%和89.06%。粉绿狐尾藻对水体硝氮净化效果最好,苦草净化效果最差。粉绿狐尾藻和空心菜均表现为前期快速下降,后期逐渐稳定,稳定时间在第20天。苦草水体硝氮在前期差异不大,后期随生物量增加净化效果提高,粉绿狐尾藻前期随生物量增加净化效果升高,后期无显著差异(图6)。最低空心菜生物量处理组(B1)第10天后,硝氮低于其他生物量处理组,这与最低生物量处理组生长状况最好有关。对硝氮去除效果进行方差分析,结果表明,实验中期(15 d),植物类型对去除效果影响极显著(P<0.01)。实验末期(30 d),植物类型和生物量对硝氮净化效果影响较小。
图6 不同水生植物和生物量对硝氮净化效果的影响
Fig. 6 Influence of different aquatic plant types and biomasses on purification effects of NO3−-N
Fig. 6 Influence of different aquatic plant types and biomasses on purification effects of NO3−-N
图6 不同水生植物和生物量对硝氮净化效果的影响
Fig. 6 Influence of different aquatic plant types and biomasses on purification effects of NO3−-N
Fig. 6 Influence of different aquatic plant types and biomasses on purification effects of NO3−-N
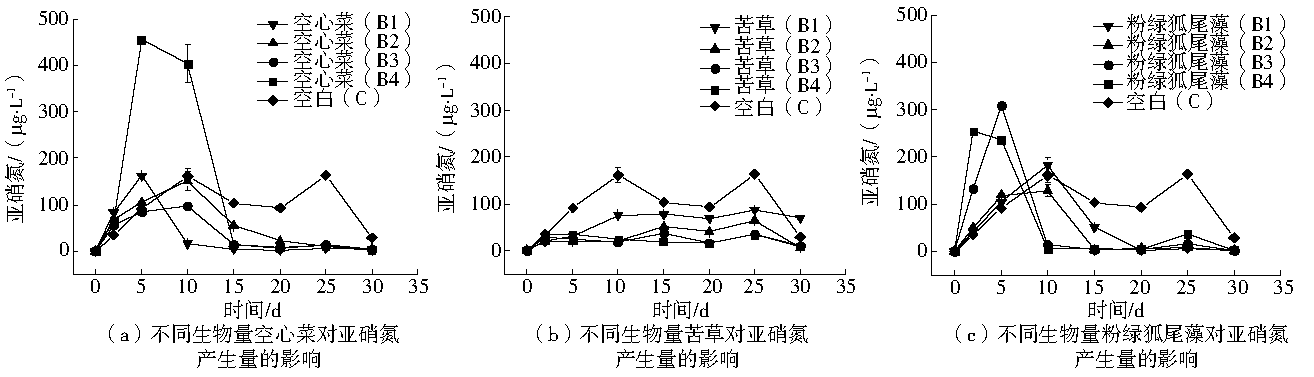
2.3.4 亚硝氮的含量变化
不同植物对水体亚硝氮含量存在显著影响,苦草、粉绿狐尾藻、空心菜3种水生植物水体亚硝氮含量平均值分别为60.29、54.06和30.88 μg·L−1,空心菜水体中亚硝氮含量最高,苦草亚硝氮含量最低。空心菜和粉绿狐尾藻水体中亚硝氮含量均表现为,实验初期逐渐升高,达到峰值后逐渐降低(图7)。最高空心菜生物量(B4)水体亚硝氮含量在第5天达到峰值,为455.60 μg·L−1。粉绿狐尾藻2个高生物量处理组(B3、B4)峰值出现在前5 d,2个低生物量处理组(B1、B2)峰值出现在第10天,高生物量的峰值出现较低生物量的提前。苦草水体亚硝氮随时间缓慢上升,亚硝氮随生物量降低而升高,苦草水体亚硝氮浓度低于空白对照。
图7 不同水生植物和生物量对亚硝氮产生量的影响
Fig. 7 Influence of different aquatic plant types and biomasses on purification effects of NO2−-N
Fig. 7 Influence of different aquatic plant types and biomasses on purification effects of NO2−-N
图7 不同水生植物和生物量对亚硝氮产生量的影响
Fig. 7 Influence of different aquatic plant types and biomasses on purification effects of NO2−-N
Fig. 7 Influence of different aquatic plant types and biomasses on purification effects of NO2−-N
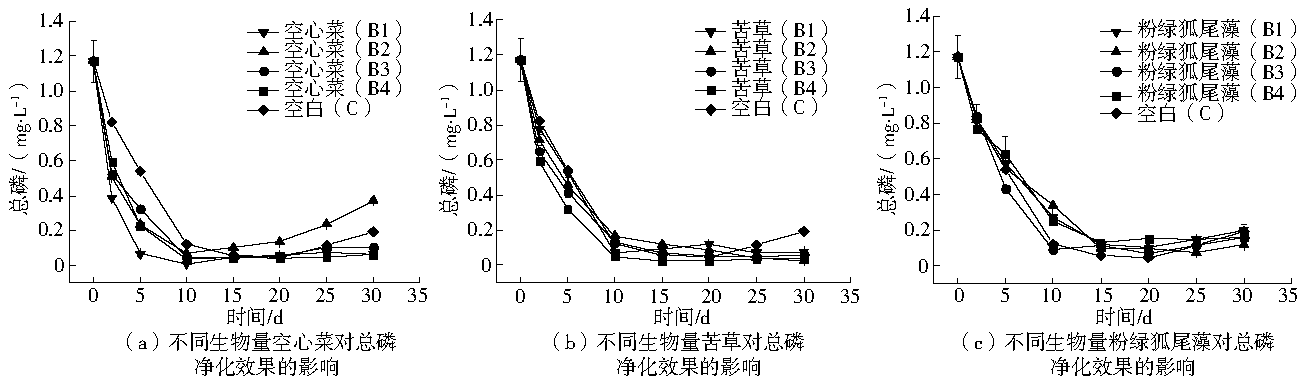
2.4 3种水生植物对总磷的去除效果
实验结果表明,不同水生植物对水体总磷去除效果不同,苦草、粉绿狐尾藻、空心菜3种水生植物对水体总磷去除率(30 d)平均值分别为95.80%、87.17%和86.24%,水生植物对总磷的平均净化效果均高于空白对照。苦草对水体总磷净化效果最好,粉绿狐尾藻净化效果最差。3种植物水体总磷浓度在前10 d下降较快,10 d以后,水体总磷浓度逐渐达到平衡(图8)。生物量对植物总磷净化效果存在影响,苦草水体总磷在实验前期随生物量增加,净化效果升高,但不同生物量净化效果整体差异不显著。空心菜净化效果受植物生长情况影响,最低生物量处理组(B1)净化效果最好,处理组(B2)在实验后期出现总磷浓度上升的情况,分析是由于植物残体打捞不及时所致。方差分析结果表明,实验初期(5 d),植物类型对总磷净化效果影响显著(P<0.05)。
图8 不同水生植物和生物量对总磷去除效果的影响
Fig. 8 Influence of different aquatic plant types and biomasses on purification effects of TP
Fig. 8 Influence of different aquatic plant types and biomasses on purification effects of TP
图8 不同水生植物和生物量对总磷去除效果的影响
Fig. 8 Influence of different aquatic plant types and biomasses on purification effects of TP
Fig. 8 Influence of different aquatic plant types and biomasses on purification effects of TP
3 讨论
在整个实验阶段,苦草和粉绿狐尾藻的生物量随时间呈不断增加趋势,且对总氮和总磷有良好的去除效果。空心菜在实验前期也表现出上述现象,后期受到高密度胁迫,出现衰亡,生物量下降。第5、15、30天,植物类型对水体溶解氧和pH影响显著(P<0.05)。沉水植物可以通过光合作用向水体输送氧气[20],造成苦草处理组DO显著高于其他2种植物处理组。空心菜和粉绿狐尾藻处理组溶解氧低于空白对照,说明和植物覆盖比,敞水有利于复氧[21]。另外,空白处理组有蓝藻大量繁殖,藻类在光照强烈的时候,光合作用也会相对较强,向水体释放O2,水体DO升高。苦草水体pH高于其他2种植物,沉水植物通过光合作用消耗水体中CO2,甚至包括HCO3−游离出的CO2,造成苦草处理组pH前期持续升高,实验后期,水体pH降低,原因可能是植物向水体释放酸性物质[22]。空白处理组pH实验初期呈上升趋势,由于空白组缺乏植物,藻类大量繁殖,藻类在光照强烈的时候,通过光合作用向水体中释放OH−,使水体pH增加[23],后期藻类死亡分解,水体pH出现下降。
总氮净化效果(30 d)受植物类型影响显著(P<0.05)。粉绿狐尾藻对总氮净化效果好于其他2种植物,从去除总氮角度,粉绿狐尾藻可以作为污水净化的先锋物种。实验前期,粉绿狐尾藻TN浓度与种植密度呈现良好的负相关关系 (R=−0.989,P<0.05)。总氮去除途径主要是水生植物对营养盐氮素的吸收和微生物的硝化-反硝化作用,以及基质的吸附沉淀作用[24]。生物量高时吸收能力较强,同时,更大的根表面积也为微生物附着提供了空间,有利于氮素的去除。高粉绿狐尾藻生物量处理组的净化效果最好,而其他2种水生植物高生物量处理组净化效果反而低,说明过高的生物量并不会带来更好的净化效果,这与宋超等[16]的研究结果一致。植物的生长情况对净化效果会产生影响,在空心菜处理组,低生物量生长情况最好,生物量在实验周期内持续升高,净化效果后期逐渐好于其他处理组,而其他高生物量处理组则出现衰亡,后期净化效果不显著,说明最低空心菜生物量处理(B1)有利于总氮的去除。苦草、粉绿狐尾藻、空心菜3种植物净化总氮最佳生物量分别为157.50、460.80和1 120.00 g。
水体中氨氮的去除途径包括植物直接吸收、吸附沉淀作用、硝化反硝化以及挥发等途径[24]。氨氮初期(5 d)净化效果受植物类型影响显著(P<0.05),不同类型植物对氨氮的净化效果(30 d)无显著差异。苦草对氨氮的净化效果最好,这与苦草处理组水体中较高的DO有关,氨氮在好氧环境下可以迅速转化为低价态的亚硝氮和硝氮[25],因此,氨氮在实验前2 d快速下降,而硝氮下降不明显且有回升,这是由于氨氮向硝氮转化造成硝氮增加的缘故。另外,苦草的吸收也是氨氮去除的重要途径[26]。在各植物处理组内,生物量对净化效果无显著差异,低空心菜处理组氨氮净化效果好于其他生物量处理组,这是由于低生物量处理给空心菜生长创造了良好的空间,在整个实验周期,低空心菜处理组生物量持续增加,说明植物生长状况对氨氮净化效果有重要影响[27]。
硝氮是污水中总氮的主要成分,硝氮的去除效果与总氮具有较强的一致性,硝氮去除的主要途径包括植物吸收、硝化反硝化等,研究认为反硝化是硝氮去除的主要途径[28]。实验中期(15 d),植物类型对硝氮去除效果影响极显著(P<0.01)。狐尾藻对硝氮的净化效果最好,分析原因是由于狐尾藻生物量较大,对硝氮具有较强的吸收能力,另外,在粉绿狐尾藻处理组,DO浓度较低,这也为硝化反硝化创造了条件,促进了硝氮的去除。
亚硝氮是硝化反硝化的中间产物[29],亚硝氮产生量受植物种类影响显著,沉水植物苦草水体亚硝氮含量显著低于其他2种植物,这和不同植物处理下水体DO有关,苦草水体DO最高,有利于硝化反应的充分进行[30],而其他2种植物处理由于较高的覆盖度,导致DO较低,所以硝化反应不完全,造成亚硝氮含量较高。这说明种植沉水植物可以改善水体环境,降低水体亚硝氮产生量。
研究[31]认为,人工湿地对总磷的主要去除途径为基质的吸附,植物吸收,以及沉淀、微生物固定等作用。实验初期(5 d),总磷净化效果受植物类型影响显著(P<0.05)。实验中苦草对总磷的净化效果好于其他2种植物,这和苦草处理组有较高的DO有关,水体的强氧化性有利于磷的化学沉淀及沉降吸附[32]。因此,苦草对总磷的吸收效果最好,可以作为去除总磷的先锋物种。较低空心菜生物量处理组总磷后期有所上升,这是由于叶片衰亡没有及时清理,导致腐烂分解,吸收的磷又回到水体。除了高苦草生物量处理组净化效果最好外,其他2种植物的过高的生物量并不会提高总磷的去除效果,高苦草生物量良好的净化效果是植物吸收和化学沉淀综合作用的结果。苦草、粉绿狐尾藻、空心菜3种植物净化总磷的最佳生物量分别为157.50、609.40和590.00 g。
4 结论
1)不同植物对污水处理厂尾水净化效果存在差异,总氮净化效果(30 d)受植物类型影响显著。粉绿狐尾藻对总氮和硝氮净化效果(30 d)最好,苦草对氨氮和总磷净化效果(30 d)最好,且苦草生长有利于降低亚硝氮的产生量,不同植物可以营造出不同的水体环境,可以利用这种差异,根据净化对象选择合适的植物,通过单独种植或串联的方式净化污水,从而发挥不同植物的净化优势。
2)实验过程中,生物量对氮磷净化效果影响较小,不同植物去除总氮的最佳生物量处理为空心菜 157.50 g、苦草460.80 g、粉绿狐尾藻1 120.00 g,总磷的最佳生物量处理为空心菜157.50 g、苦草609.40 g、粉绿狐尾藻590.00 g。
3)不同生物量处理对空心菜生长存在影响,较高的空心菜生物量处理到后期会出现衰败,而低生物量处理组在实验周期内持续生长,植物生长情况继而对尾水净化效果产生影响,造成高生物量净化效果低于低生物量,建议使用空心菜净化污水时,使用低生物量处理,且在其达到最大生物量(610.00~880.00 g)之前进行收割。
 下载:
下载:
