

-
微塑料(MPs, 1 μm—5 mm) [1]和纳米塑料(NPs, < 1 μm) [2]的环境污染问题已成为一个全球性问题. 纳米塑料由于体积小、比表面积大,具有较强的流动性,不仅能够影响土壤的理化性质和结构,而且可以显著地在其表面吸附更多的污染物[2-5],如多环芳烃[6-7]、农用化学品[8]、多氯联苯[9]和四环素[10]等. 由于地膜和污水污泥产品的使用,农田中NPs的积累可能会对对土壤生态系统造成直接或间接的影响[11-14],并沿着食物链传递,可能威胁到土壤微生物和人类. 虽然有越来越多的证据表明环境中纳米塑料的存在及其带来的风险,但由于缺乏适当的检测方法,很少有人研究土壤基质中的纳米塑料,目前在纳米塑料的检测和定量方面仍存在知识空白[15-19]. 因此,迫切需要建立一种成本低且可靠的检测方法分析土壤基质中的纳米塑料[20].
目前,环境中纳米塑料最常见的分析过程是密度浮选分离样品、过滤预富集、对有机基质进行化学消解,使用透射电子显微镜(TEM)[21-22]、(微观)傅里叶变换红外光谱(FTIR)[23-24]和拉曼光谱(Raman)进行检测[25-27]. 但这些方法存在回收率低、成本高、样本量小、耗时长等缺点. 此外FTIR和Raman的空间分辨率分别为20 μm和1 μm,从而阻碍了它们在纳米塑料分析中的应用[28-34]. 目前,已经有一些技术,如纳米颗粒跟踪分析(NTA)[24,35],单颗粒电感耦合等离子体质谱(spICP-MS)[36],云点提取与热降解相结合技术,以及结合粒度分级的高分辨率分析技术已被用于量化纳米塑料. 然而,这些技术往往受到复杂的环境基质和低浓度的纳米塑料的限制[21]. 目前,热裂解气相色谱-质谱技术(Py-GC-MS)可以很好地用于复杂环境基质中纳米塑料的分析,并被认为是一种很有前景的分析方法[20-21, 37-42]. Py-GC-MS可以克服FTIR和Raman光谱的缺点[21,43-45],并已成功用于识别添加到水和土壤中的纳米塑料标准品. Wahl等[3]使用Py-GC-MS从农业土壤样品的水提取物中发现PE、PS和PVC纳米塑料. 最近,Zhou等[42]证明了通过蛋白质电冕耦合Py-GC-MS技术测定水中纳米塑料的可行性. Zhou等[20]首次提出了一种基于Triton X-45(TX-45)的浊点萃取(CPE)技术,用于水体环境中痕量纳米塑料的预富集,得出PS纳米塑料的回收率为84.6%—96.6%. 然而,关于土壤环境中纳米塑料的研究却微乎其微,这主要是因为它们的浓度水平较低,缺乏可靠的提取、预浓缩和定量方法[20,37,42]. 针对当前纳米塑料研究的不足,本研究可以为土壤中纳米塑料的检测和定量分析提供一定的技术支持.
本文的主要目的是建立一种从农田土壤中提取和定量纳米塑料的方法. 聚苯乙烯(PS)纳米塑料被选为纳米塑料模型,从浮选溶质的选择、消解液的类型和浓度3个方面对萃取过程进行了优化;研究了腐植酸(HA)和纳米塑料粒径对纳米塑料萃取效率的影响;评价了检测方法的精密度、重现性和检出限,并应用该技术对实际土壤样品中的纳米塑料进行检测和定量分析.
-
氯化钠(NaCl)、碘化钠(NaI)和氯化锌(ZnCl2)为分析纯,购自上海化学试剂公司(中国上海). 将NaCl、NaI和ZnCl2溶液溶解在超纯水中,使其密度分别达到1.2、1.8、1.6 g·mL−1. 30%过氧化氢(H2O2)溶液购自国药化学试剂有限公司(中国上海). 3种PS纳米塑料的直径为25、100、800 nm,购自Phosphorex (Hopkinton, MA)公司. 本实验中所用的玻璃微纤维过滤器(直径25 mm,孔径1 μm)产自Whatman (Maidstone, England)公司.
土壤样品采自辽宁省沈阳市农用地,主要使用两种类型的农业用地:一是农田,主要种植玉米和大豆;另一种是蔬菜大棚,主要种植蔬菜和水果,如黄瓜、西红柿和西瓜. 根据调查,在过去的10年,这片土地经常被耕种,在种植过程中使用塑料膜覆盖作物留下了大量的塑料碎片. 用铲子在每个采样地0—5 cm处随机取样,共选取6种作物类型的农田进行采样. 将采来的土样放在阴凉处风干,在半干状态时压碎土块,除去植物根、茎、叶和石块等杂物. 然后将土壤样品过1 mm的不锈钢筛网进行筛分. 测得土壤理化性质为:pH值为7.1;阳离子交换量为15.3 cmol·kg−1;总有机物含量为2.29%;总有机碳含量为1.33%;孔隙率为52.4%;含水率为13.5%;黏土占10.5%;粉砂占39.6%;砂土占49.9%.
-
本实验称取100 g土壤样品,放入500 mL烧杯中,加入10% KOH溶液与土壤混合,置于磁力搅拌器上. 磁力搅拌器的温度设定为60 ℃,转子速度为300 r·min−1,持续搅拌消解48 h,再将样品置于60 ℃的水浴中,直至溶剂完全蒸发. 向烘干的消解产物中加入200 mL的ZnCl2盐溶液进行密度浮选,在45 ℃,300 r·min−1的磁搅拌器上放置6 h以上,使纳米塑料颗粒与土壤分离,悬浮于ZnCl2溶液中,静置沉淀. 采用孔径为1 μm的玻璃纤维滤膜过滤ZnCl2浮选液. 将滤液放入250 mL烧杯中,于60 ℃水浴锅中蒸发干燥后浓缩至1 mL;接着将烧杯置于25 ℃,300 r·min−1的磁力搅拌器上搅拌3 min,以促进纳米塑料的均匀分散. 最后提取60 μL的浓溶液,转移到80 μL的裂解杯中,再放入45 ℃烘箱中干燥. 此步骤重复3次. 干燥后放入Py-GC-MS设备中进行检测分析. 采用空白对照以确保没有任何仪器或材料污染样品.
在回收率实验中,先将PS纳米塑料置于室外,暴露在气候变化的自然环境中,在太阳光紫外线的作用下进行老化. 老化60 d后再将粒径为25 nm PS纳米塑料以100 μg·g−1的浓度加入到土壤中并混合均匀. 考察了浮选介质和消解液对纳米塑料回收率的影响,优化密度浮选过程. NaCl、ZnCl2和NaI的密度分别为1.2、1.6、1.8 g·cm−3时被认为是有效且相对便宜的浮选介质. 在添加了PS纳米塑料的100 g土壤样品中,分别添加20 mL不同浓度的 KOH(2%—15%)和H2O2(5%—40%)溶液. 此外,本实验还考察了向土壤中加入不同浓度的DOM(5、10、20、40 mg·L−1)和PS塑料粒径(25、100、800 nm)对萃取纳米塑料的影响.
-
多孔裂解器(EGA/PY-3030D, Frontier Laboratories, Japan)与配备了ULTRA ALLOY-5(5%二苯基二甲聚硅氧烷)金属毛细管柱(30 m × 0.25 mm i.d. × 0.25 µm)(P/N: UA5(MS/HT)-30M-0.25F, Frontier Laboratories)的Thermo Scientific TRACE ULTRA气相色谱仪连接,并与Thermo ISQ质谱检测器连接. Py-GC-MS的实验参数设置如表1所示. 为了简化数据分析,Py-GC-MS检测得到的数据用F-search软件和NIST 02质谱库进行处理. F-search谱库可以快速检索塑料聚合物热解产物的质谱,同时可以轻松地将未知聚合物的数据与Py-GC-MS获得的数据进行比较,实现未知物质的快速分析.
-
为了在复杂的土壤样品中识别PS纳米塑料,需要提供特定的指示性化合物. 因此,通过热解法测定聚合物标准品,建立了PS纳米塑料数据库. 将获得的总离子流图和质谱图与文献数据进行比较. 选择含量最丰富且具有特异性的化合物作为聚合物定性和定量分析的指标. 通过使用PS特征离子的质谱图和积分结果,用预先选择的特异性化合物对PS进行外部校准. 本研究使用Origin 2019b (OriginLab Corporation)计算PS纳米塑料的拟合曲线.
-
关于PS纳米塑料的指示化合物信息列于表2中,裂解色谱图如图1所示. PS有两种有益的指示化合物,苯乙烯单体及其三聚体,它们在特异性和丰度上不同. 其中苯乙烯单体(m/z 104)的含量最高,苯乙烯三聚体(m/z 312)特异性最高. 虽然苯乙烯单体的含量较高,但由于甲壳素广泛存在于自然环境中,在热解过程中会释放苯乙烯单体,因此不能用于PS的鉴定和定量. 相比之下,苯乙烯三聚体对聚苯乙烯具有更高的可靠性和特异性,由于m/z 91对苯乙烯三聚体具有最强的信号强度,因此选择其作为定量离子. 所以,苯乙烯三聚体是合适的指示化合物[46].
-
为获得较高的回收率,本研究对浮选液类型进行了优化. 研究了不同密度(1.2—1.8 g·cm−3)的NaCl、NaI和ZnCl2溶液用于回收PS纳米塑料的优化[47]. 结果如表3所示. NaI、ZnCl2和NaCl溶液对粒径为25 nm的PS塑料的回收率分别为85.7% ± 5.3%、84.3% ± 4.8%和63.6% ± 4.5%. 以NaI (1.8 g·cm−3)和ZnCl2 (1.6 g·cm−3)为浮选溶质时PS纳米塑料的回收率高于以NaCl (1.2 g·cm−3)为浮选溶质时的回收率. 以NaI和ZnCl2溶液作为浮选溶液时的回收率没有显著差异. 因此基于成本和回收率的综合考虑,最后选择ZnCl2溶液作为浮选溶液.
-
由于H2O2和KOH碱性溶液已被证明能有效地溶解环境中的有机质,所以研究了不同浓度的H2O2和KOH溶液对土壤中PS纳米塑料回收率的影响. 结果如表4所示. 结果表明,以KOH碱性溶液为消解液时的PS纳米塑料的平均回收率高于以H2O2为消解液时的PS纳米塑料的回收率. PS纳米塑料的回收率随H2O2和KOH溶液浓度的增加而增加. KOH溶液浓度从2%增加到10%时,回收率从52.6%增加到81.6%. 当KOH浓度为15%时,PS纳米塑料的回收率较高(82.6%). 10%和15% KOH溶液的回收率无显著差异. 当H2O2浓度为30%时,PS纳米塑料的最大回收率为76.7%. 因此,本实验选择10% KOH溶液作为消解液[47]. 这些结果与早期的研究结果相符. Thiele等[48]比较了此前其他研究中使用的消解技术,并推荐KOH作为暴露风险研究中最可行的消解方法. Karami等[49]指出,用10% KOH溶液处理可以有效地消化生物材料,并且不会影响塑料聚合物的完整性.
-
以粒径为25、100、800 nm的PS纳米塑料为研究对象,考察了粒径对PS纳米塑料回收率的影响,结果见表5. 结果表明,粒径为25、100、800 nm的PS纳米塑料回收率分别为87.58% ± 6.5%、88.88% ± 7.7%和88.94% ± 5.02%. 不同粒径时对PS纳米塑料的回收率影响不显著,说明粒径对提取方法的影响可以忽略不计.
-
为了研究不同浓度的DOM对PS纳米塑料回收的影响,本研究中采用了5、10、20、40 mg·L−1 的DOM溶液添加到土壤中进行实验. 结果如表6所示. 在不添加DOM的情况下,PS纳米塑料的回收率为87.1% ± 6.3%. 在土壤中分别加入5、10、20、40 mg·L−1 DOM溶液后,PS纳米塑料的回收率分别为86.8% ± 6.8%、84.0% ± 7.0%、86.0% ± 6.9%和88.7% ± 3.8%. 结果表明,在土壤中添加DOM对PS纳米塑料的回收率影响不大,说明DOM浓度对从土壤中提取纳米塑料方法的影响可以忽略不计. 这进一步证明了纳米塑料萃取方法的可靠性和稳定性.
-
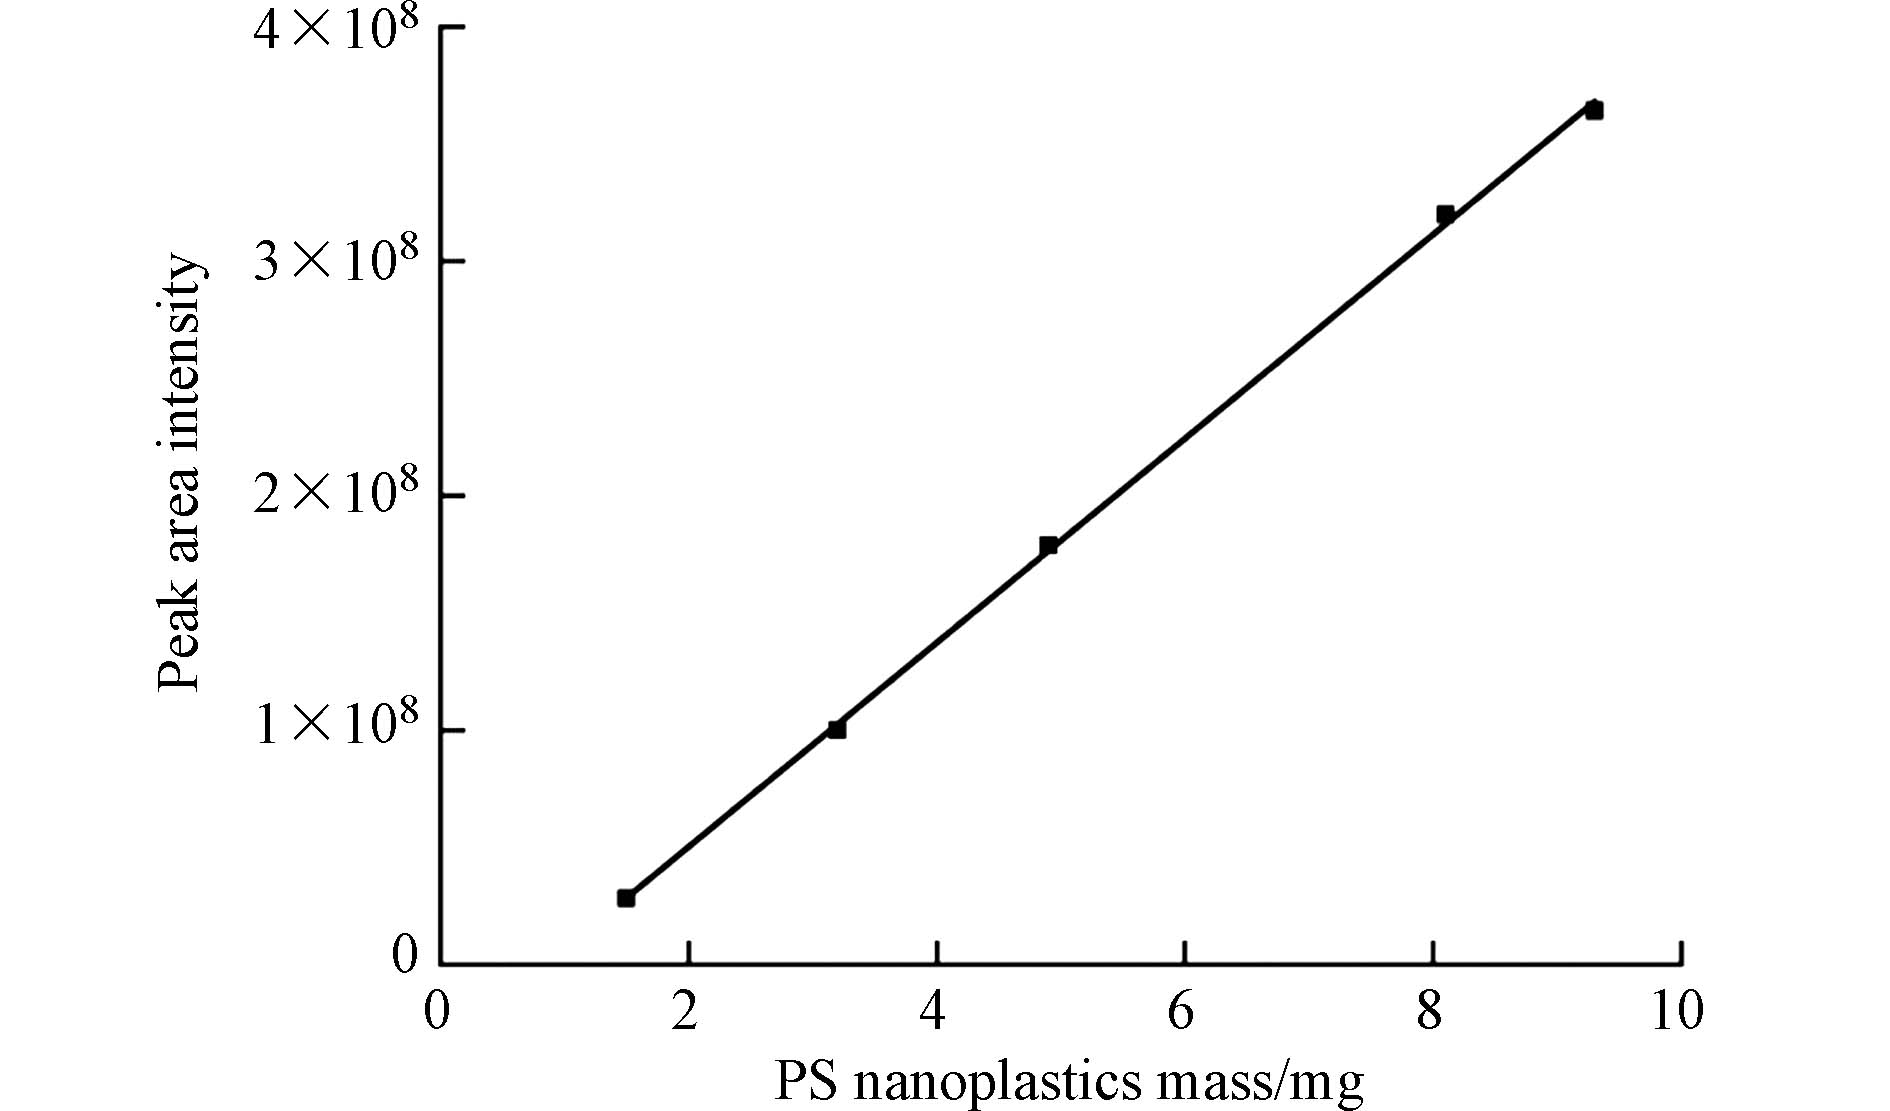
测定了相对标准偏差(RSD)、相关系数(R2)、检出限(LOD)和定量限(LOQ)等参数,对其性能进行了评价. PS纳米塑料的分析数据如表7所示. Py-GC-MS重复检测5次PS纳米塑料的标准样品,测得精密度为7.04%. 该结果与Steinmetz等[50]的研究结果一致,他们发现测量重复性为3.2%—7.2%. 如图2所示,PS纳米塑料在0.110 mg范围内,其校准曲线函数线性良好,R2为0.9995. 此外,PS的检出限为3倍信噪比(S/N = 3),为0.012 μg,定量限为10倍信噪比(S/N = 10),定量限为0.04 μg. LOD和LOQ的数据表明该仪器的灵敏度和适用性,可用于纳米塑料的检测. 这些结果与Duemichen等[51]的研究结果相似,PS的仪器检测限为3—200 ng, PE、PP和PET的检测限为0.5—50 g.
从土壤中萃取PS纳米塑料方法的性能分析,准备5个100 g的土壤样品,加入1 μg·g−1 粒径为25 nm PS纳米塑料,按照上述的萃取方法提取PS纳米塑料,测定5个加标样品的回收率. 结果如表8所示,通过计算得到RSD为3.25%,说明方法的重复性良好,方法的检出限(MDL)为0.086 μg·g−1,方法的定量限可达0.34 μg·g−1,表明该方法的可靠性和灵敏性良好.
-
为进一步验证该方法的可靠性,在6个土壤样品中加入100 μg·g−1 粒径为25 nm PS纳米塑料测定回收率. 由表9可知,25 nm PS纳米塑料在6个土壤样品中的回收率分别为87.5% ± 3.5%、82.4% ± 5.7%、79.6% ± 6.3%、88.3% ± 4.6%、77.8% ± 5.2%和82.6% ± 6.8%. 因此,为了研究从土壤基质中提取纳米塑料方法的可行性,立即采集了6个实际土壤样品进行分析. 土样详细情况见表9,其中在4个样品中检测到PS塑料,浓度为3.45—10.26 μg·g−1,辣椒大棚中的浓度最大为10.26 μg·g−1,而在玉米地和黄豆地样品中没有检测到PS纳米塑料,这可能是因为它们的浓度较小,低于检出限. Wahl等[3]首次提供了证据,证明在土壤基质中发现了纳米塑料,并覆盖了3种最常见的塑料类型:聚乙烯、聚苯乙烯和聚氯乙烯. 这些结果证明了所提出的方法在复杂土壤基质中分析纳米塑料的能力和实用性.
-
(1)本研究为土壤基质中纳米塑料分析提供了一种可行的方法. 通过密度浮选、碱性消解和膜过滤等前处理过程,再采用Py-GC-MS进行检测,成功地对土壤基质中的纳米塑料进行了定性和定量分析. 通过对PS塑料标准品的分析,测定重复性为7.04% RSDs,LOD为0.012 μg. 对萃取方法的性能进行分析得到RSD%为3.25%,方法的检出限为0.086 μg·g−1,结果表明了本研究方法具有良好的准确度和精密度,可用于纳米塑料的定量分析.
(2)通过对萃取条件的优化,选择ZnCl2作为最佳的浮选溶质,10% KOH溶液作为消解液. 研究结果表明,纳米塑料粒径的大小和DOM的存在对土壤中纳米塑料的回收率几乎没有影响.
(3)在6个土壤样品中加入粒径为25 nm 浓度为100 μg·g−1 的PS纳米塑料测定回收率为77.8%—88.3%,其中在4个样品中检测到PS塑料,浓度为3.45—10.26 μg·g−1,辣椒大棚中的浓度最大为10.26 μg·g−1. 说明了该技术是土壤系统中纳米塑料分析的一种有效可靠的方法.
基于热裂解气相色谱-质谱技术对农田土壤中纳米塑料的检测方法
Detection method of nanoplastics in farmland soils by pyrolysis−gas chromatography−mass spectrometry
-
摘要: 纳米塑料因其在环境中的普遍分布及其潜在的不利影响引起了人们的极大关注. 尽管纳米塑料已经在水生态系统中被检测到,但土壤中纳米塑料的检测和定量分析仍然是一个未解决的挑战. 因此,本文以聚苯乙烯(PS)颗粒作为土壤基质中纳米塑料(NPs)模型,基于热裂解-气相色谱-质谱(Py-GC-MS)技术,提出了一种灵敏、有效、低成本的萃取方法用于对纳米塑料的鉴定和定量. 从农田土壤中提取纳米塑料的过程包括密度浮选、碱性消解、水浴蒸发和膜过滤. 在采用10% KOH为消解液、ZnCl2 (ρ=1.6 g·cm−3)为浮选液的最佳萃取条件下,PS纳米塑料的萃取效率最高. 此外,为了验证所提出方法的可行性,采集并检测了6个实际土壤样品. 研究结果表明,在添加浓度为100 μg·g−1的25 nm聚苯乙烯纳米塑料的6个实际土壤样品中,PS纳米塑料的回收率为77.8%—88.3%. 检测结果显示,4个土壤样品中检测到PS纳米塑料,浓度为3.45—10.26 μg·g−1,其余2个样品没有检测到纳米塑料,这可能是由于PS纳米塑料的浓度低于检测限. 说明纳米塑料的分析检测方法是可行的. 因此,本研究为土壤基质中纳米塑料的分析提供了一种有效的方法.
-
关键词:
- 纳米塑料 /
- 检测 /
- 定量 /
- 农田土壤 /
- 热裂解-气相色谱-质谱.
Abstract: Nanoplastics have attracted extensive attention due to ubiquitous distribution in the environment and potential adverse impacts. Although nanoplastics have been detected in aquatic ecosystems, their detection and quantitative analysis in soil remain an unsolved challenge. Therefore, a sensitive, effective, and low-cost extraction procedure is put forward for identification and quantification of nanoplastics (NPs) based on Pyrolysis-Gas Chromatography-Mass Spectrometry (Py-GC-MS) with polystyrene (PS) particles as a model NPs in soil samples. The procedures of extracting nanoplastics from farmland soils included density flotation, alkaline digestion, water bath evaporation and membrane filtration. The highest extraction efficiency for PS was achieved using the 10% KOH as digestion solution and ZnCl2 (ρ=1.6 g·cm−3) as flotation solution. Furthermore, six actual soil samples were collected and detected to verify the feasibility of the proposed approach. The results demonstrated that the recovery of PS was 77.8%—88.3% with 25 nm PS of 100 μg·g−1 added in six actual soil samples. The test results showed that PS were detected in four soil samples at concentrations ranging from 3.45 μg·g−1 to 10.26 μg·g−1, while no PS were detected in the other two samples, due to the concentration of PS was below the detection limit. The analysis and detection method of NPs was feasible. Therefore, this study provided an efficient method for nanoplastics analysis in soil.-
Key words:
- nanoplastics /
- detection /
- quantification /
- farmland soils /
- Py-GC-MS.
-

-
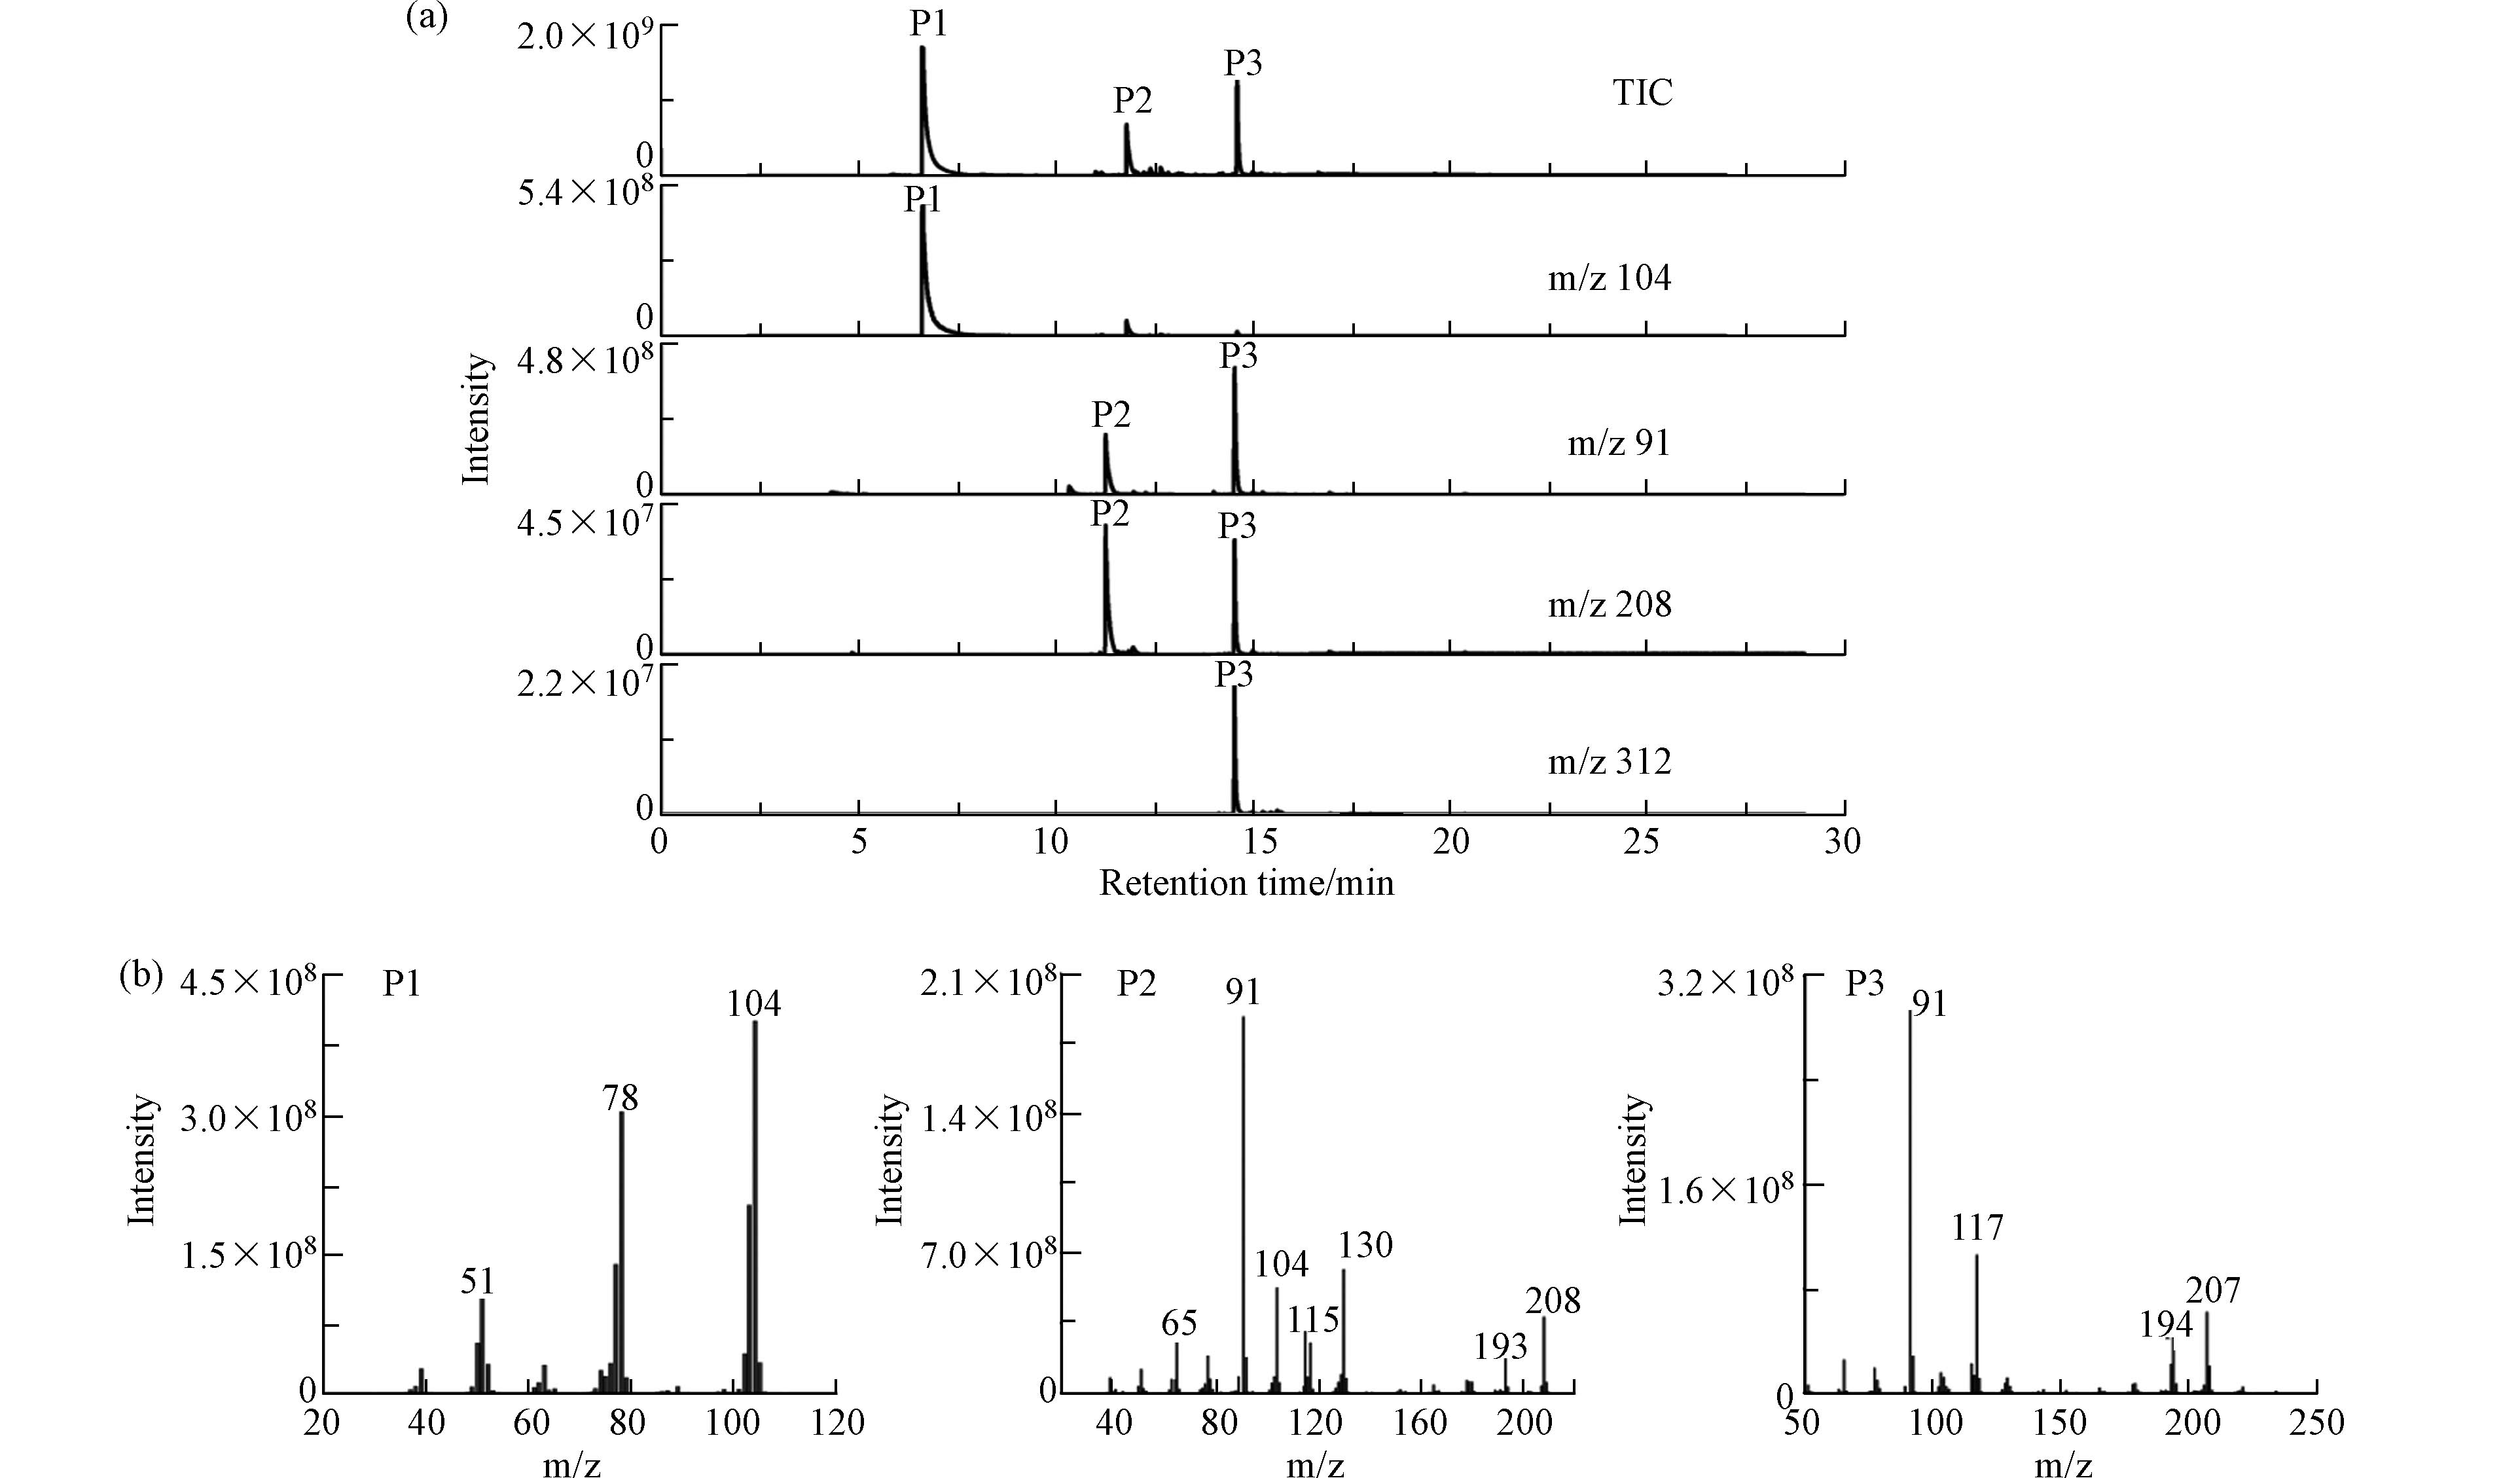
图 1 (a)为PS的总离子流(TIC)图和选定指示化合物的离子色谱图;(b)为PS特征裂解产物的质谱
Figure 1. (a)is the total ion current (TIC) and the ion chromatogram of selected indicator compounds of PS. (b)is the mass spectra of the characteristic pyrolysis products of PS
表 1 Py-GC-MS检测条件
Table 1. Conditions for Py-GC-MS detection
裂解炉
PyrolyzerFrontier EGA/PY-3030D 载气
Carrier gas氦气 裂解温度
Pyrolysis temperature600 ℃ 裂解炉与GC的界面温度
Interface temperature320 ℃ 气相色谱
Gas chromatographThermo TRACE GC ULTRA 分流比
Split ratio1:100 流量
Flow (const.)1 mL·min−1 毛细管柱
ColumnUltra ALLOY-5(30 m×0.25 mm×0.25 μm,5%二苯基聚硅氧烷+95%二甲基聚硅氧烷) GC进口温度
GC inlet temperature320 ℃ 传输线温度
Transfer line temperature280 ℃ GC-MS界面温度
Interface temperature320 ℃ 程序升温
Temperature program40 ℃(2 min), 以20 ℃·min−1加热到320 ℃(13 min) 质谱
Mass spectrometerThermo ISQ EI源电离能
EI ionization energy70 eV 源温度
Source temperature230 ℃ 扫描范围
Scanning range35—600 m/z  下载: 导出CSV
表 2 PS纳米塑料的热解行为及热解图信息
Table 2. Pyrolytic behavior of PS nanoplastics and pyrogram information
峰
Peak特征裂解产物
Characteristic decomposition product指标离子
Indicator ions(m/z)保留时间/min
Retention timeP1 苯乙烯单体(styrene) 51、78、104 5.24 P2 苯乙烯二聚体(styrene dimer) 91、104、115、130、193、208 11.26 P3 苯乙烯三聚体(styrene trimer) 91、117、194、207 14.54 m/z = 质荷比. m/z = mass to charge ratio.
下载: 导出CSV
表 3 不同浮选溶液条件下PS纳米塑料的回收率
Table 3. The recovery parameters of PS nanoplastics in different flotation solutions
浮选溶液
Flotation solution
typesPS添加浓度/
(μg·g−1)
PS spike concentration检测浓度/(μg·g−1)
Detection concentration回收率/%
Recovery平均回收率
(平均值±SDa) /%
Average recovery1 2 3 1 2 3 NaCl 100 68.4 62.7 59.6 68.4 62.7 59.6 63.6±4.5 ZnCl2 100 79.6 84.2 89.2 79.6 84.2 89.2 84.3±4.8 NaI 100 80.5 85.6 91.1 80.5 85.6 91.1 85.7±5.3 a:SD为标准偏差. a: SD is the standard deviation.
下载: 导出CSV
表 4 不同类型、不同浓度消解液中PS纳米塑料的回收率参数
Table 4. The recovery parameters of PS nanoplastics in different types and concentrations of digestion liquid
消解溶液
Digestion
solution浓度/%
ConcentrationPS添加浓度/(μg·g−1)
PS spike concentration检测浓度/(μg·g−1)
Detection concentration回收率/%
Recovery平均回收率
(平均值±SDa)/%
Average recovery1 2 3 1 2 3 KOH 2 100 50.5 58.9 48.4 50.5 58.9 48.4 52.6±5.6 5 100 54.9 63.7 60.6 54.9 63.7 60.6 59.7±4.5 7 100 63.7 65.9 69.2 63.7 65.9 69.2 66.3±2.8 KOH 10 100 78.1 80.5 86.3 78.1 80.5 86.3 81.6±4.2 15 100 87.4 83.4 76.9 87.4 83.4 76.9 82.6±5.3 H2O2 5 100 46.3 41.9 38.4 46.3 41.9 38.4 42.2±4.0 10 100 47.8 49.4 46.9 47.8 49.4 46.9 48.0±1.3 20 100 68.9 65.2 60.5 68.9 65.2 60.5 64.9±4.2 30 100 77.4 76.8 75.9 77.4 76.8 75.9 76.7±0.75 40 100 78.9 73.8 74.6 78.9 73.8 74.6 75.8±2.7 a:SD为标准偏差. a: SD is the standard deviation.
下载: 导出CSV
表 5 不同粒径条件下PS纳米塑料的回收率(n = 5)
Table 5. The recovery of PS nanoplastics with different particle sizes (n = 5)
粒径尺寸/nm
Particle sizesPS添加浓度/(μg·g−1)
PS spike concentration检测浓度/(μg·g−1)
Detection concentration回收率/%
Recovery平均回收率
(平均值±SDa)/%
Average recovery1 2 3 4 5 1 2 3 4 5 25 100 88.5 94.3 92.6 78.2 84.3 88.5 94.3 92.6 78.2 84.3 87.58±6.5 100 100 92.3 84.6 77.5 93.8 96.2 92.3 84.6 77.5 93.8 96.2 88.88±7.7 800 100 94.3 87.9 81.4 92.7 88.4 94.3 87.9 81.4 92.7 88.4 88.94±5.02 a. SD为标准偏差. a. SD is the standard deviation.
下载: 导出CSV
表 6 不同DOM浓度下PS纳米塑料的回收率 (n =5)
Table 6. The recovery of PS nanoplastics at different DOM concentrations (n =5)
DOM浓度/(mg·L−1)
DOM ConcentrationPS添加浓度/(μg·g−1)
PS spike concentration检测浓度/(μg·g−1)
Detection concentration回收率/%
Recovery平均回收率
(平均值±SD)a/%
Average recovery1 2 3 4 5 1 2 3 4 5 0 100 85.6 78.9 90.4 84.9 95.8 85.6 78.9 90.4 84.9 95.8 87.1±6.3 5 100 84.6 76.4 87.9 93.6 91.6 84.6 76.4 87.9 93.6 91.6 86.8±6.8 10 100 91.5 82.7 80.4 74.9 90.3 91.5 82.7 80.4 74.9 90.3 84.0±7.0 20 100 78.1 90.4 93.5 79.3 88.6 78.1 90.4 93.5 79.3 88.6 86.0±6.9 40 100 84.4 90.3 91.5 85.8 91.6 84.4 90.3 91.5 85.8 91.6 88.7±3.8 a. SD为标准偏差. a. SD is the standard deviation.
下载: 导出CSV
表 7 PS纳米塑料相关校准数据
Table 7. Calibration related data for the PS nanoplastics
聚合物类型
Polymer typePS 指标化合物
Indicator compoundstyrene trimer 保留时间/min
Retention time14.54 指示离子
Indicator ion m/z91 进样量范围/mg
Sampling range0.1—10 标准曲线方程
Calibration functionsY=4.35×10⁷X-3.69×10⁷ R2 0.9995 RSD/%,(n=5) 7.04 LOD/μg 0.012 LOQ/μg 0.04 注:R² =相关系数,RSD% =相对标准偏差,LOD =检出限,LOQ =定量限,X=PS的质量, Y=色谱峰面积.
下载: 导出CSV
表 8 萃取PS纳米塑料方法的性能参数
Table 8. Performance parameters of extraction methods for PS nanoplastics
样品编号
Sample No.PS添加浓度/(μg·g−1)
PS spike concentration检测浓度/(μg·g−1)
Detection concentration回收率/%
Recovery1 1 0.843 84.3 2 1 0.862 86.2 3 1 0.811 81.1 4 1 0.823 82.3 5 1 0.865 86.5 平均回收率(平均值±SD)a/% 84.02 ± 2.73 RSD/% 3.25
下载: 导出CSV
表 9 土壤样品的测定结果
Table 9. Determination results of soil samples
样品名称
Sample name采样位置坐标
Sampling coordinatesPS添加浓度
/(μg·g−1)
PS spike concentration检测浓度
/(μg·g−1)
Detection concentration回收率/%
Recovery黄瓜大棚 41°46' N 123°52' E 0 3.45 100 87.5 87.5 ± 3.5 西红柿大棚 41°48' N , 123°45' E 0 5.72 100 82.4 82.4 ± 5.7 辣椒大棚 42°6' N , 123°32' E 0 10.26 100 79.6 79.6 ± 6.3 玉米地 41°46' N , 123°52' E 0 N.D. 100 88.3 88.3 ± 4.6 西瓜地 42°7' N , 123°30' E 0 9.71 100 77.8 77.8 ± 5.2 黄豆地 41°33' N , 123°21' E 0 N.D. 100 82.6 82.6 ± 6.8 N.D. 表示未检出. N.D. means not detected.
下载: 导出CSV
-
[1] FRIAS J P G L, NASH R. Microplastics: Finding a consensus on the definition [J]. Marine Pollution Bulletin, 2019, 138: 145-147. doi: 10.1016/j.marpolbul.2018.11.022 [2] LIAN J P, WU J N, ZEB A, et al. Do polystyrene nanoplastics affect the toxicity of cadmium to wheat (Triticum aestivum L. )? [J]. Environmental Pollution, 2020, 263: 114498. doi: 10.1016/j.envpol.2020.114498 [3] WAHL A, le JUGE C, DAVRANCHE M, et al. Nanoplastic occurrence in a soil amended with plastic debris [J]. Chemosphere, 2021, 262: 127784. doi: 10.1016/j.chemosphere.2020.127784 [4] de SOUZA MACHADO A A, KLOAS W, ZARFL C, et al. Microplastics as an emerging threat to terrestrial ecosystems [J]. Global Change Biology, 2018, 24(4): 1405-1416. doi: 10.1111/gcb.14020 [5] PIEHL S, LEIBNER A, LÖDER M G J, et al. Identification and quantification of macro- and microplastics on an agricultural farmland [J]. Scientific Reports, 2018, 8: 17950. doi: 10.1038/s41598-018-36172-y [6] RICHARD H, CARPENTER E J, KOMADA T, et al. Biofilm facilitates metal accumulation onto microplastics in estuarine waters [J]. Science of the Total Environment, 2019, 683: 600-608. doi: 10.1016/j.scitotenv.2019.04.331 [7] ZHOU Y F, LIU X N, WANG J. Characterization of microplastics and the association of heavy metals with microplastics in suburban soil of central China [J]. Science of the Total Environment, 2019, 694: 133798. doi: 10.1016/j.scitotenv.2019.133798 [8] RODRÍGUEZ-SEIJO A, SANTOS B, da SILVA E A F, et al. Low-density polyethylene microplastics as a source and carriers of agrochemicals to soil and earthworms [J]. Environmental Chemistry, 2019, 16: 8-17. doi: 10.1071/EN18162 [9] VELZEBOER I, KWADIJK C J A F, KOELMANS A A. Strong sorption of PCBs to nanoplastics, microplastics, carbon nanotubes, and fullerenes [J]. Environmental Science & Technology, 2014, 48(9): 4869-4876. [10] XU B L, LIU F, BROOKES P C, et al. Microplastics play a minor role in tetracycline sorption in the presence of dissolved organic matter [J]. Environmental Pollution, 2018, 240: 87-94. doi: 10.1016/j.envpol.2018.04.113 [11] HARATA K, KITAGAWA S, IIGUNI Y, et al. Identification of polymer species in a complex mixture by pyrolysis-gas chromatography-atmospheric pressure chemical ionization-high resolution time-of-flight mass spectrometry as a basis for environmental microplastic analysis [J]. Journal of Analytical and Applied Pyrolysis, 2020, 148: 104828. doi: 10.1016/j.jaap.2020.104828 [12] IVLEVA N P, WIESHEU A C, NIESSNER R. Microplastic in aquatic ecosystems [J]. Angewandte Chemie International Edition, 2017, 56(7): 1720-1739. doi: 10.1002/anie.201606957 [13] de SOUZA MACHADO A A, LAU C W, KLOAS W, et al. Microplastics can change soil properties and affect plant performance [J]. Environmental Science & Technology, 2019, 53(10): 6044-6052. [14] NG E L, HUERTA LWANGA E, ELDRIDGE S M, et al. An overview of microplastic and nanoplastic pollution in agroecosystems [J]. Science of the Total Environment, 2018, 627: 1377-1388. doi: 10.1016/j.scitotenv.2018.01.341 [15] GUO J J, HUANG X P, XIANG L, et al. Source, migration and toxicology of microplastics in soil [J]. Environment International, 2020, 137: 105263. doi: 10.1016/j.envint.2019.105263 [16] YU L, ZHANG J D, LIU Y, et al. Distribution characteristics of microplastics in agricultural soils from the largest vegetable production base in China [J]. Science of the Total Environment, 2021, 756: 143860. doi: 10.1016/j.scitotenv.2020.143860 [17] HARMS I K, DIEKÖTTER T, TROEGEL S, et al. Amount, distribution and composition of large microplastics in typical agricultural soils in Northern Germany [J]. Science of the Total Environment, 2021, 758: 143615. doi: 10.1016/j.scitotenv.2020.143615 [18] SHEN M C, ZHANG Y X, ZHU Y, et al. Recent advances in toxicological research of nanoplastics in the environment: A review [J]. Environmental Pollution, 2019, 252: 511-521. doi: 10.1016/j.envpol.2019.05.102 [19] SANA S S, DOGIPARTHI L K, GANGADHAR L, et al. Effects of microplastics and nanoplastics on marine environment and human health [J]. Environmental Science and Pollution Research International, 2020, 27(36): 44743-44756. doi: 10.1007/s11356-020-10573-x [20] ZHOU X X, HAO L T, WANG H Y, et al. Cloud-point extraction combined with thermal degradation for nanoplastic analysis using pyrolysis gas chromatography-mass spectrometry [J]. Analytical Chemistry, 2019, 91(3): 1785-1790. doi: 10.1021/acs.analchem.8b04729 [21] ZHOU X X, HE S, GAO Y, et al. Quantitative analysis of polystyrene and poly(methyl methacrylate) nanoplastics in tissues of aquatic animals [J]. Environmental Science & Technology, 2021, 55(5): 3032-3040. [22] SOBHANI Z, ZHANG X, GIBSON C, et al. Identification and visualisation of microplastics/nanoplastics by Raman imaging (i): Down to 100 nm [J]. Water Research, 2020, 174: 115658. doi: 10.1016/j.watres.2020.115658 [23] HERNANDEZ L M, XU E G, LARSSON H, et al. Plastic teabags release billions of microparticles and nanoparticles into tea [J]. Environmental Science & Technology, 2019, 53(21): 12300-12310. [24] GONZÁLEZ-PLEITER M, TAMAYO-BELDA M, PULIDO-REYES G, et al. Secondary nanoplastics released from a biodegradable microplastic severely impact freshwater environments [J]. Environmental Science:Nano, 2019, 6(5): 1382-1392. doi: 10.1039/C8EN01427B [25] FANG C, SOBHANI Z, ZHANG X, et al. Identification and visualisation of microplastics/nanoplastics by Raman imaging (ii): Smaller than the diffraction limit of laser? [J]. Water Research, 2020, 183: 116046. doi: 10.1016/j.watres.2020.116046 [26] GILLIBERT R, BALAKRISHNAN G, DESHOULES Q, et al. Raman tweezers for small microplastics and nanoplastics identification in seawater [J]. Environmental Science & Technology, 2019, 53(15): 9003-9013. [27] ZHANG W, DONG Z Q, ZHU L, et al. Direct observation of the release of nanoplastics from commercially recycled plastics with correlative Raman imaging and scanning electron microscopy [J]. ACS Nano, 2020, 14(7): 7920-7926. doi: 10.1021/acsnano.0c02878 [28] CAI H W, XU E G, DU F N, et al. Analysis of environmental nanoplastics: Progress and challenges [J]. Chemical Engineering Journal, 2021, 410: 128208. doi: 10.1016/j.cej.2020.128208 [29] GANGADOO S, OWEN S, RAJAPAKSHA P, et al. Nano-plastics and their analytical characterisation and fate in the marine environment: From source to sea [J]. Science of the Total Environment, 2020, 732: 138792. doi: 10.1016/j.scitotenv.2020.138792 [30] PIVOKONSKY M, CERMAKOVA L, NOVOTNA K, et al. Occurrence of microplastics in raw and treated drinking water [J]. Science of the Total Environment, 2018, 643: 1644-1651. doi: 10.1016/j.scitotenv.2018.08.102 [31] ZHENG S, ZHAO Y F, LIANGWEI W H, et al. Characteristics of microplastics ingested by zooplankton from the Bohai Sea, China [J]. Science of the Total Environment, 2020, 713: 136357. doi: 10.1016/j.scitotenv.2019.136357 [32] MATERI\U0107 D, KASPER-GIEBL A, KAU D, et al. Micro- and nanoplastics in alpine snow: A new method for chemical identification and (semi)quantification in the nanogram range [J]. Environmental Science & Technology, 2020, 54(4): 2353-2359. [33] RIBEIRO F, OKOFFO E D, O'BRIEN J W, et al. Quantitative analysis of selected plastics in high-commercial-value Australian seafood by pyrolysis gas chromatography mass spectrometry [J]. Environmental Science & Technology, 2020, 54(15): 9408-9417. [34] KUSCH P. Challenges in the analysis of micro- and nanoplastics//Handbook of Microplastics in the Environments[M]. Cham: Springer International Publishing, 2022: 477-501. [35] SCHWAFERTS C, SOGNE V, WELZ R, et al. Nanoplastic analysis by online coupling of Raman microscopy and field-flow fractionation enabled by optical tweezers [J]. Analytical Chemistry, 2020, 92(8): 5813-5820. doi: 10.1021/acs.analchem.9b05336 [36] JIMÉNEZ-LAMANA J, MARIGLIANO L, ALLOUCHE J, et al. A novel strategy for the detection and quantification of nanoplastics by single particle inductively coupled plasma mass spectrometry (ICP-MS) [J]. Analytical Chemistry, 2020, 92(17): 11664-11672. doi: 10.1021/acs.analchem.0c01536 [37] TER HALLE A, JEANNEAU L, MARTIGNAC M, et al. Nanoplastic in the north Atlantic subtropical gyre [J]. Environmental Science & Technology, 2017, 51(23): 13689-13697. [38] OKOFFO E D, O'BRIEN S, RIBEIRO F, et al. Plastic particles in soil: State of the knowledge on sources, occurrence and distribution, analytical methods and ecological impacts [J]. Environmental Science. Processes & Impacts, 2021, 23(2): 240-274. [39] FISCHER M, SCHOLZ-BÖTTCHER B M. Microplastics analysis in environmental samples–recent pyrolysis-gas chromatography-mass spectrometry method improvements to increase the reliability of mass-related data [J]. Analytical Methods, 2019, 11(18): 2489-2497. doi: 10.1039/C9AY00600A [40] PATIL S M, RANE N R, BANKOLE P O, et al. An assessment of micro- and nanoplastics in the biosphere: A review of detection, monitoring, and remediation technology [J]. Chemical Engineering Journal, 2022, 430: 132913. doi: 10.1016/j.cej.2021.132913 [41] PENG C, TANG X J, GONG X Y, et al. Development and application of a mass spectrometry method for quantifying nylon microplastics in environment [J]. Analytical Chemistry, 2020, 92(20): 13930-13935. doi: 10.1021/acs.analchem.0c02801 [42] ZHOU X X, HE S, GAO Y, et al. Protein Corona-mediated extraction for quantitative analysis of nanoplastics in environmental waters by pyrolysis gas chromatography/mass spectrometry [J]. Analytical Chemistry, 2021, 93(17): 6698-6705. doi: 10.1021/acs.analchem.1c00156 [43] FADARE O O, WAN B, GUO L H, et al. Microplastics from consumer plastic food containers: Are we consuming it? [J]. Chemosphere, 2020, 253: 126787. doi: 10.1016/j.chemosphere.2020.126787 [44] MITRANO D M, BELTZUNG A, FREHLAND S, et al. Synthesis of metal-doped nanoplastics and their utility to investigate fate and behaviour in complex environmental systems [J]. Nature Nanotechnology, 2019, 14(4): 362-368. doi: 10.1038/s41565-018-0360-3 [45] NGUYEN B, CLAVEAU-MALLET D, HERNANDEZ L M, et al. Separation and analysis of microplastics and nanoplastics in complex environmental samples [J]. Accounts of Chemical Research, 2019, 52(4): 858-866. doi: 10.1021/acs.accounts.8b00602 [46] FISCHER M, SCHOLZ-BÖTTCHER B M. Simultaneous trace identification and quantification of common types of microplastics in environmental samples by pyrolysis-gas chromatography-mass spectrometry [J]. Environmental Science & Technology, 2017, 51(9): 5052-5060. [47] CAO J H, ZHAO X N, GAO X D, et al. Extraction and identification methods of microplastics and nanoplastics in agricultural soil: A review [J]. Journal of Environmental Management, 2021, 294: 112997. doi: 10.1016/j.jenvman.2021.112997 [48] THIELE C J, HUDSON M D, RUSSELL A E. Evaluation of existing methods to extract microplastics from bivalve tissue: Adapted KOH digestion protocol improves filtration at single-digit pore size [J]. Marine Pollution Bulletin, 2019, 142: 384-393. doi: 10.1016/j.marpolbul.2019.03.003 [49] KARAMI A, GOLIESKARDI A, CHOO C K, et al. A high-performance protocol for extraction of microplastics in fish [J]. Science of the Total Environment, 2017, 578: 485-494. doi: 10.1016/j.scitotenv.2016.10.213 [50] STEINMETZ Z, KINTZI A, MUÑOZ K, et al. A simple method for the selective quantification of polyethylene, polypropylene, and polystyrene plastic debris in soil by pyrolysis-gas chromatography/mass spectrometry [J]. Journal of Analytical and Applied Pyrolysis, 2020, 147: 104803. doi: 10.1016/j.jaap.2020.104803 [51] DUEMICHEN E, EISENTRAUT P, CELINA M, et al. Automated thermal extraction-desorption gas chromatography mass spectrometry: A multifunctional tool for comprehensive characterization of polymers and their degradation products [J]. Journal of Chromatography A, 2019, 1592: 133-142. doi: 10.1016/j.chroma.2019.01.033 -
 点击查看大图
计量
- 文章访问数: 1606
- HTML全文浏览数: 1606
- PDF下载数: 41
- 施引文献: 0
