


大气中持久性有机污染物在气相和颗粒相中的分配特征研究进展
Progress on the gas/particle partitioning of persistent organic pollutants in atmosphere
-
摘要: 大气中持久性有机污染物(POPs)的气(气相)-粒(颗粒相)分配是影响POPs在大气中分布、迁移和转化的一个重要因素,研究POPs的气-粒分配特征有助于提高POPs环境归趋预测的准确性,对区域范围内的大气POPs污染防治具有重要意义. 本文简要介绍了两种经典的POPs气-粒分配理论及模型,总结了有关大气中几类典型POPs在气相和颗粒相中的分配特征研究的最新进展,讨论了不同种类POPs气-粒分配的一些差异性特征和可能的影响因素,并提出了大气中新型POPs气-粒分配特征研究中亟待解决的问题.Abstract: Gas/particle partitioning of persistent organic pollutants(POPs)is an essential factor that affects the distribution, transport and transformation of POPs in the atmosphere. The investigation of the gas/particle partitioning of POPs in atmosphere could help improve the accuracy in predicting the fate of POPs and control the regional POPs contamination in the atmosphere. In this study, two classical models for the prediction of POPs gas/particle partitioning were briefly described.The latest progress about the distribution of some typical POPs in the gas phase and particle phase weresummarized. In addition, the characteristics and possible influence factors of different POPs were discussed, and some issues that need to be solved in the future study were proposed.
-
近年来随着我国城镇化水平的深入推进,城市下垫面不透水层比率迅速提高,加速了径流形成过程,缩短了径流汇集时间;与此同时,人类活动增加了蓄积在城市下垫面污染物的种类和数量。二者共同作用,使得由地表径流引发的城市水体污染问题日益突出[1]。生物滞留池是用于城市雨洪管理的一种低影响开发(low impact development, LID)技术,其可通过地表径流原位滞留调节峰值流量,并通过吸附、生物吸收和降解以去除地表径流中的污染物[2]。有研究表明,生物滞留池对传统目标污染物,如重金属[3]、多环芳烃[4]、总氮、总磷等均具有较好的去除效果[5-6]。
全氟化合物(perfluorinated compounds, PFCs)是一种典型的新污染物,作为表面活性剂和保护剂被广泛应用于日常用品及工业生产中。PFCs具有生物毒性和生物累积性,可在人体内蓄积造成健康危害[7]。城市下垫面累积的全氟和多氟烷基化合物(per/polyfluoroalkyl substances, PFASs)主要来源于大气PFASs及其前体物的传输和沉降[8-9],并在雨水冲刷下进入受纳水体。有研究表明,雨季河水中的PFASs浓度水平明显高于旱季[10]。因此,地表径流中的PFCs含量不可忽视,明确生物滞留池对PFCs的削减效能对城市面源污染防治和可持续发展具有十分重要的现实意义和科学价值。
传统生物滞留系统的填料层(bioretention soil media,BSM)常由土壤与细砂混合而成,具有良好的渗透性能[11]。近年来,以煤质活性炭、沸石等为主要改良剂的生物滞留池得到了广泛运用。活性炭层可明显提高脱氮效率,使氨氮(NH3-N)和总氮(TN)的平均去除率达到80.27%和59.45%[12],沸石层对多环芳烃的去除率达40%以上[13]。然而,改良填料层对PFCs的去除能力及各污染物在系统中的空间分布特征尚不清楚。为此,本研究通过构建不同填料的生物滞留系统,利用为期1 a的模拟实验考察了改良填料下生物滞留池的水量削减效能,分析了其对常规污染物和PFCs的去除效果,探讨了PFCs是否影响常规污染物去除及其长期运行能力,以期为城市雨洪综合管理提供参考。
1. 材料与方法
1.1 生物滞留池装置构建
生物滞留装置采用有机玻璃PMMA材料制成,高度1 500 mm,直径400 mm。距池顶150 mm处设溢流口,沿柱体向下每间隔150 mm设置取样口,共8个取样口,取样口均封有纱网布。设备底部预留滞留体积,接直径为25 mm出水管(图1)。滞留装置基质层填料类别不宜过多,BSM由河沙、土、树皮按质量比65:30:5比例构成[14]。JIANG等[15]设置BSM+10%绿色沸石、BSM+10%粉煤灰等6种改良生物滞留系统,其对溶解性污染物较好均有较好的去除效果。因此,本研究中1#生物滞留池填料层由BSM+10% 2~4 mm沸石(BSM+10% Zeolite)组成;2#池填料层由BSM+10% 2~4 mm煤质颗粒活性炭(BSM+10% GAC)组成。滞留装置由下至上分别是150 mm砾石排水层(粒径24 mm)、600 mm填料层和300 mm的种植层。种植层填料为场地附近红土,种有生性强健、耐阴耐湿的紫芋。种植层表面为50 mm高的覆盖层,材料为树皮。各层间由土工布隔开并预留出200 mm高蓄水层。锡纸包裹柱体种植层以下外壁,模拟无光环境,为厌氧菌提供生存条件。为防止短流,1#生物滞留池内侧用云石胶贴有砾石。
1.2 实验设计
根据ZENG等[16]的研究,采用NH4Cl、KNO3、KH2PO4、尿素、葡萄糖、7种PFCs配置人工雨水。PFCs包括全氟辛酸(perfluorooctanoic acid,PFOA)、全氟丁酸(perfluorobutanoic acid,PFBA)、全氟辛基磺酸(perfluorooctane acid,PFOS)、全氟戊酸(perfluoropentanoic acid,PFPeA)、全氟己酸(perfluorohexanoic acid,PFHxA)、全氟庚酸(perfluoroheptanoic acid,PFHpA)和全氟壬酸(perfluorononanoic acid,PFNA)。污染物分别为1.5 mg·L−1
NH+4 NO−3 表 1 生物滞留装置实验条件设计Table 1. Experimental condition design (for a single bioretention column)实验条件 进水浓度 重现期/a 降雨历时/min 实验水量/L 降雨间隔/d 1 c 0.5 180 58 3 2 c 0.5 180 58 10 3 2c 0.5 180 58 20 | Show Table DownLoad:
CSV
DownLoad:
CSV
1.3 试剂和检测方法
硝酸钾和硫酸(AR,纯度>95%)购自广州化学试剂公司;无水硫代硫酸钠(纯度>99%)购自上海阿拉丁生化科技股份有限公司;葡萄糖购自上海润捷化学试剂有限公司;氯化铵购自CNW公司(德国);磷酸二氢钾购自天津市科密欧化学试剂有限公司;OasisWAXSPE柱(6cc,150mg)购自Waters公司(美国)。
采用HACH DRB200消解器和DR3900分光光度计,根据《水和废水监测分析方法 (第四版) 》中的国家标准或行业标准分析方法测定:COD采用快速消解法、TN采用碱性过硫酸钾消解紫外分光光度法、TP采用钼锑抗分光光度法、
NH+4 NO−3 1.4 数据处理方法
利用Masslynx软件对PFCs数据进行处理。水量削减效果使用水量削减率
RV Rc RV=Vin−Vout−VoverVin×100% (1) Rc=Cin−CoutCin×100% (2) 式中:
RV Rc Vin、Vout、Vover Cin、Cout 2. 结果与讨论
2.1 水量调控效果分析
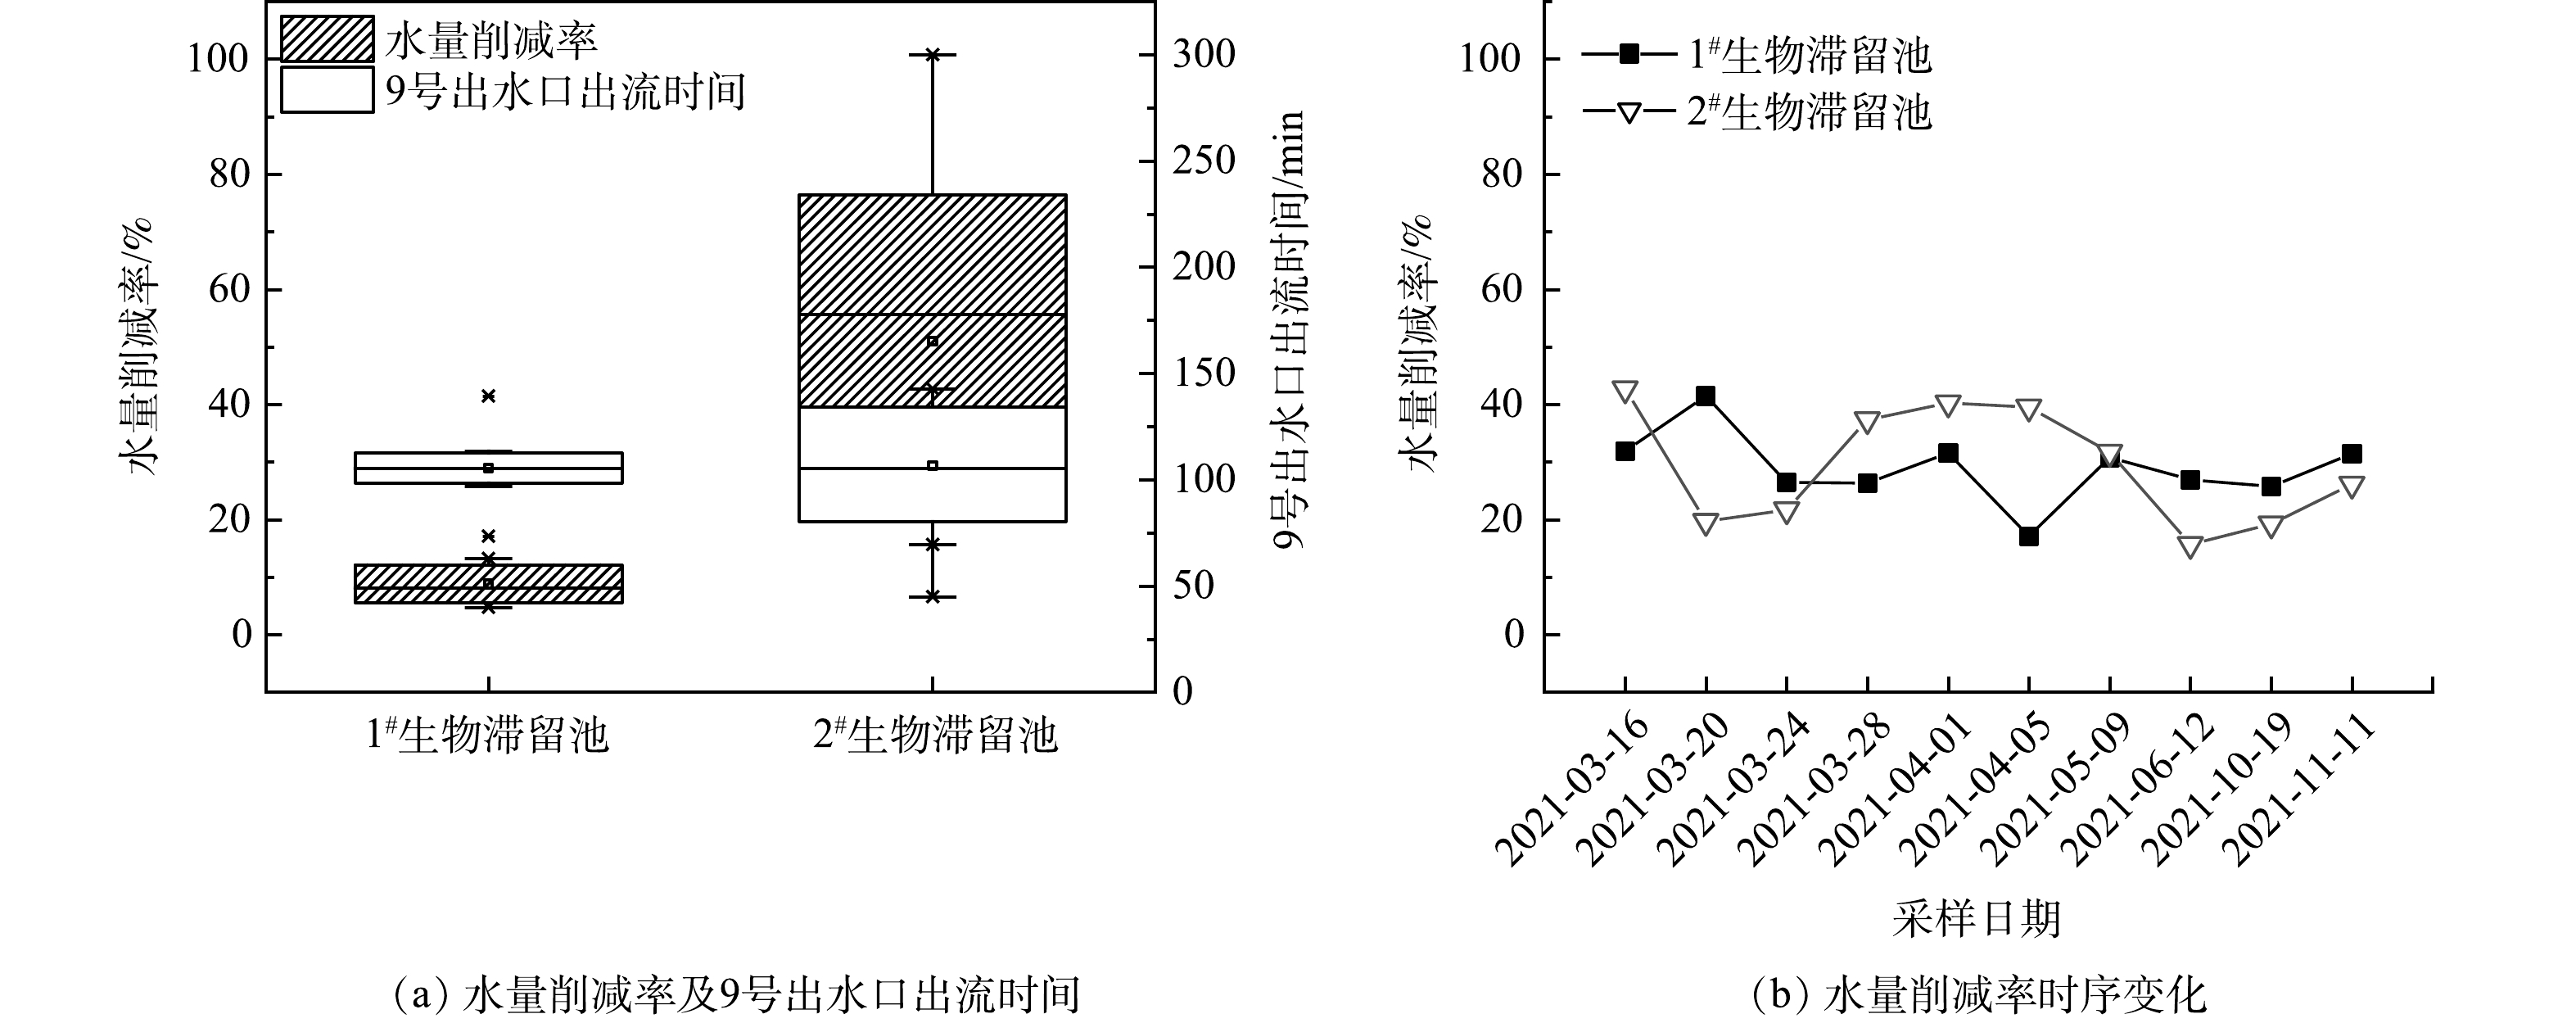
生物滞留装置底部出水口出流时间和水量削减率如图2(a)所示。1#生物滞留池首次出流时间稳定,平均值为(51±9) min。2#生物滞留池平均出流时间高于1#生物滞留池且不稳定,平均值为(165±90) min;其运行初期出流时间高于后期,尤其在投入使用0.5 a后底部出流明显加快。这说明2#生物滞留池填料透水率随运行时间增加而增高,提示长期运行时需考虑煤质活性炭在雨水浸泡后的老化情况和使用年限。1#生物滞留池水量削减率为17.13%~41.48%,2#生物滞留池为15.67%~42.7%,两池的水量削减率相当。匡彬等[17]的研究表明,在P=1、2 a 等小重现期降雨条件下,绿色雨水系统对径流量和峰流量的削减效果较好。当降雨强度为1 a一遇时,径流总量削减率达到21.7%。本研究中重现期设定为0.5 a, 1#和2#生物滞留池水量削减率平均值分别为30.3%和29.4%,削减率与文献报道结果一致[18]。图2(b)为生物滞留池水量削减率随运行时间的变化情况。如图2所示,削减率随运行时间增长呈现波动下降的趋势,其中,2#生物滞留池削减率后期下降趋势更为明显。
2.2 常规污染物去除效果分析
1)常规污染物在生物滞留池中纵向迁移情况。为考查污染物在滞留池中的纵向迁移规律,获取连续3次降雨间隔为10 d的各出水口常规污染物去除率。如图3(a)~(b)所示,目标污染物的去除率随池深增加而提高,说明填料层对常规污染物去除起到关键作用。其中活性炭的比表面积、微孔体积大,有利于为基质提供更多的吸附位点;沸石表面呈粗糙多孔结构,这有利于对离子的物理吸附[19]。
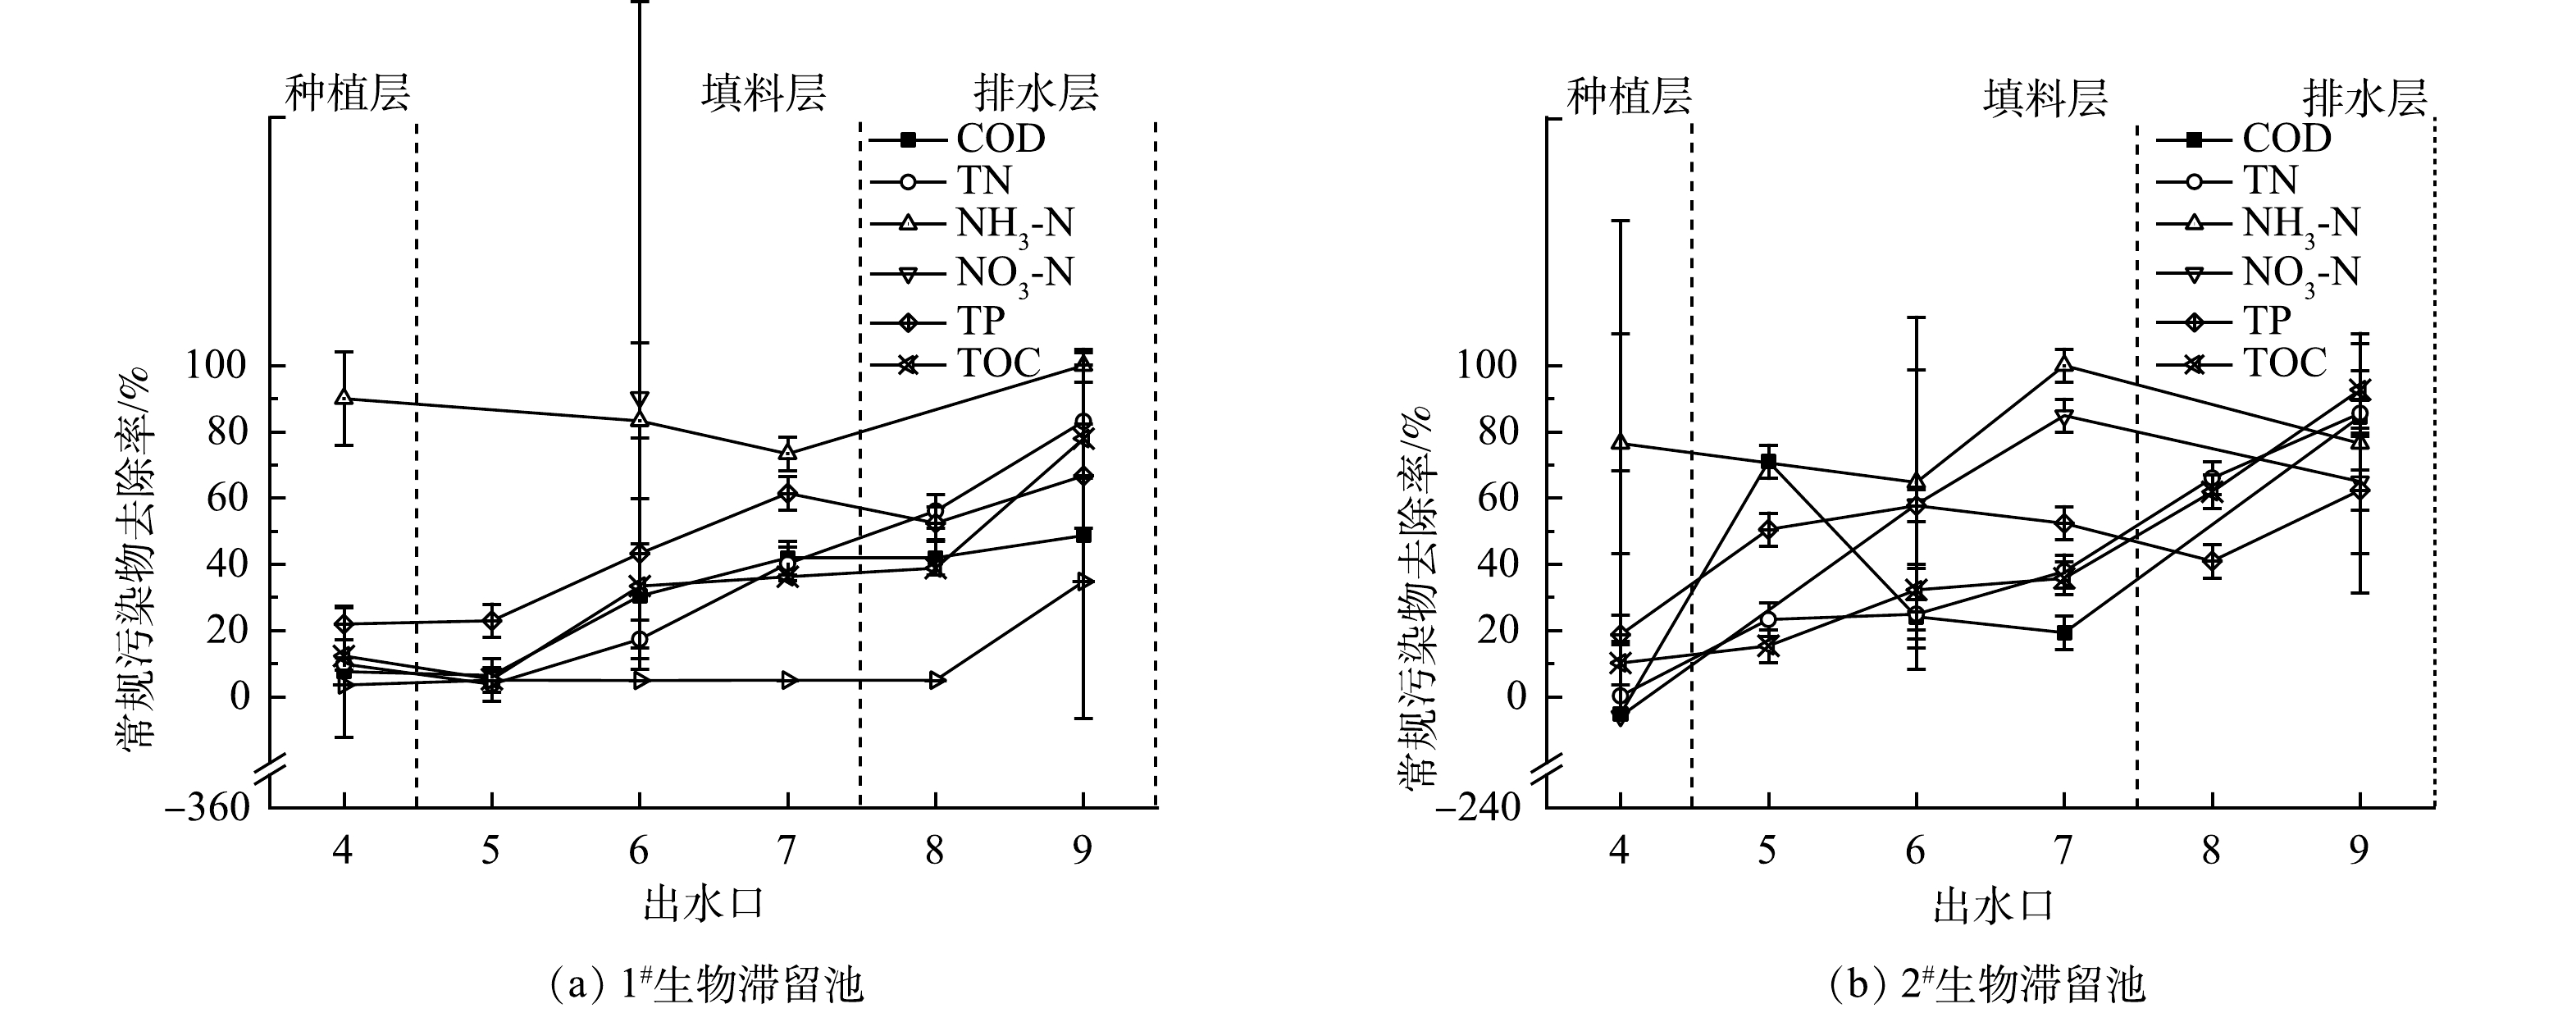 图 3 生物滞留池对常规污染物的去除效果Figure 3. Removal effect of conventional pollutants by bioretention system
1#生物滞留池由上至下对COD、TP、TOC的去除率均逐渐上升。9号出水口COD、TP、TOC的去除率为48.68%、66.71%、 77.96%。1#生物滞留池对
NH+4 NO−3 NH+4 NO−3 NO−3 NH+4 NO−3 2)生物滞留池对常规污染物去除效果的长期稳定性情况。为考察生物滞留池对常规污染物的长期去除性能,系统在8个月内以不同实验条件进行了非连续地降雨实验,其中实验条件1在3—4月,条件2在5—8月,条件3在9—11月下进行。如图4(a)所示,1#生物滞留池COD去除率呈稳定并略有上升的趋势。由38.97%(3月)增长至87.69%(11月);2#生物滞留池COD去除率较1#生物滞留池波动明显,但除去2次异常低值后,COD去除率达80%以上。2#生物滞留池的2次异常低值,分别出现在第1次实验和与前次实验间隔期间较长的第7次实验,考虑为COD浸出与气候的影响。由图4(b)可见,2组生物滞留池对TN的去除效果有着不同的趋势。1#生物滞留池波动较大,去除率偏低,TN去除率由40.52%增至运行后期的95.28%。2#生物滞留池恰好相反,前期TN去除率较高,后期降低。由图4(c)可见,2组生物滞留池对
NH+4 NH+4 NO−3 NO−3 NO−3 NH+4 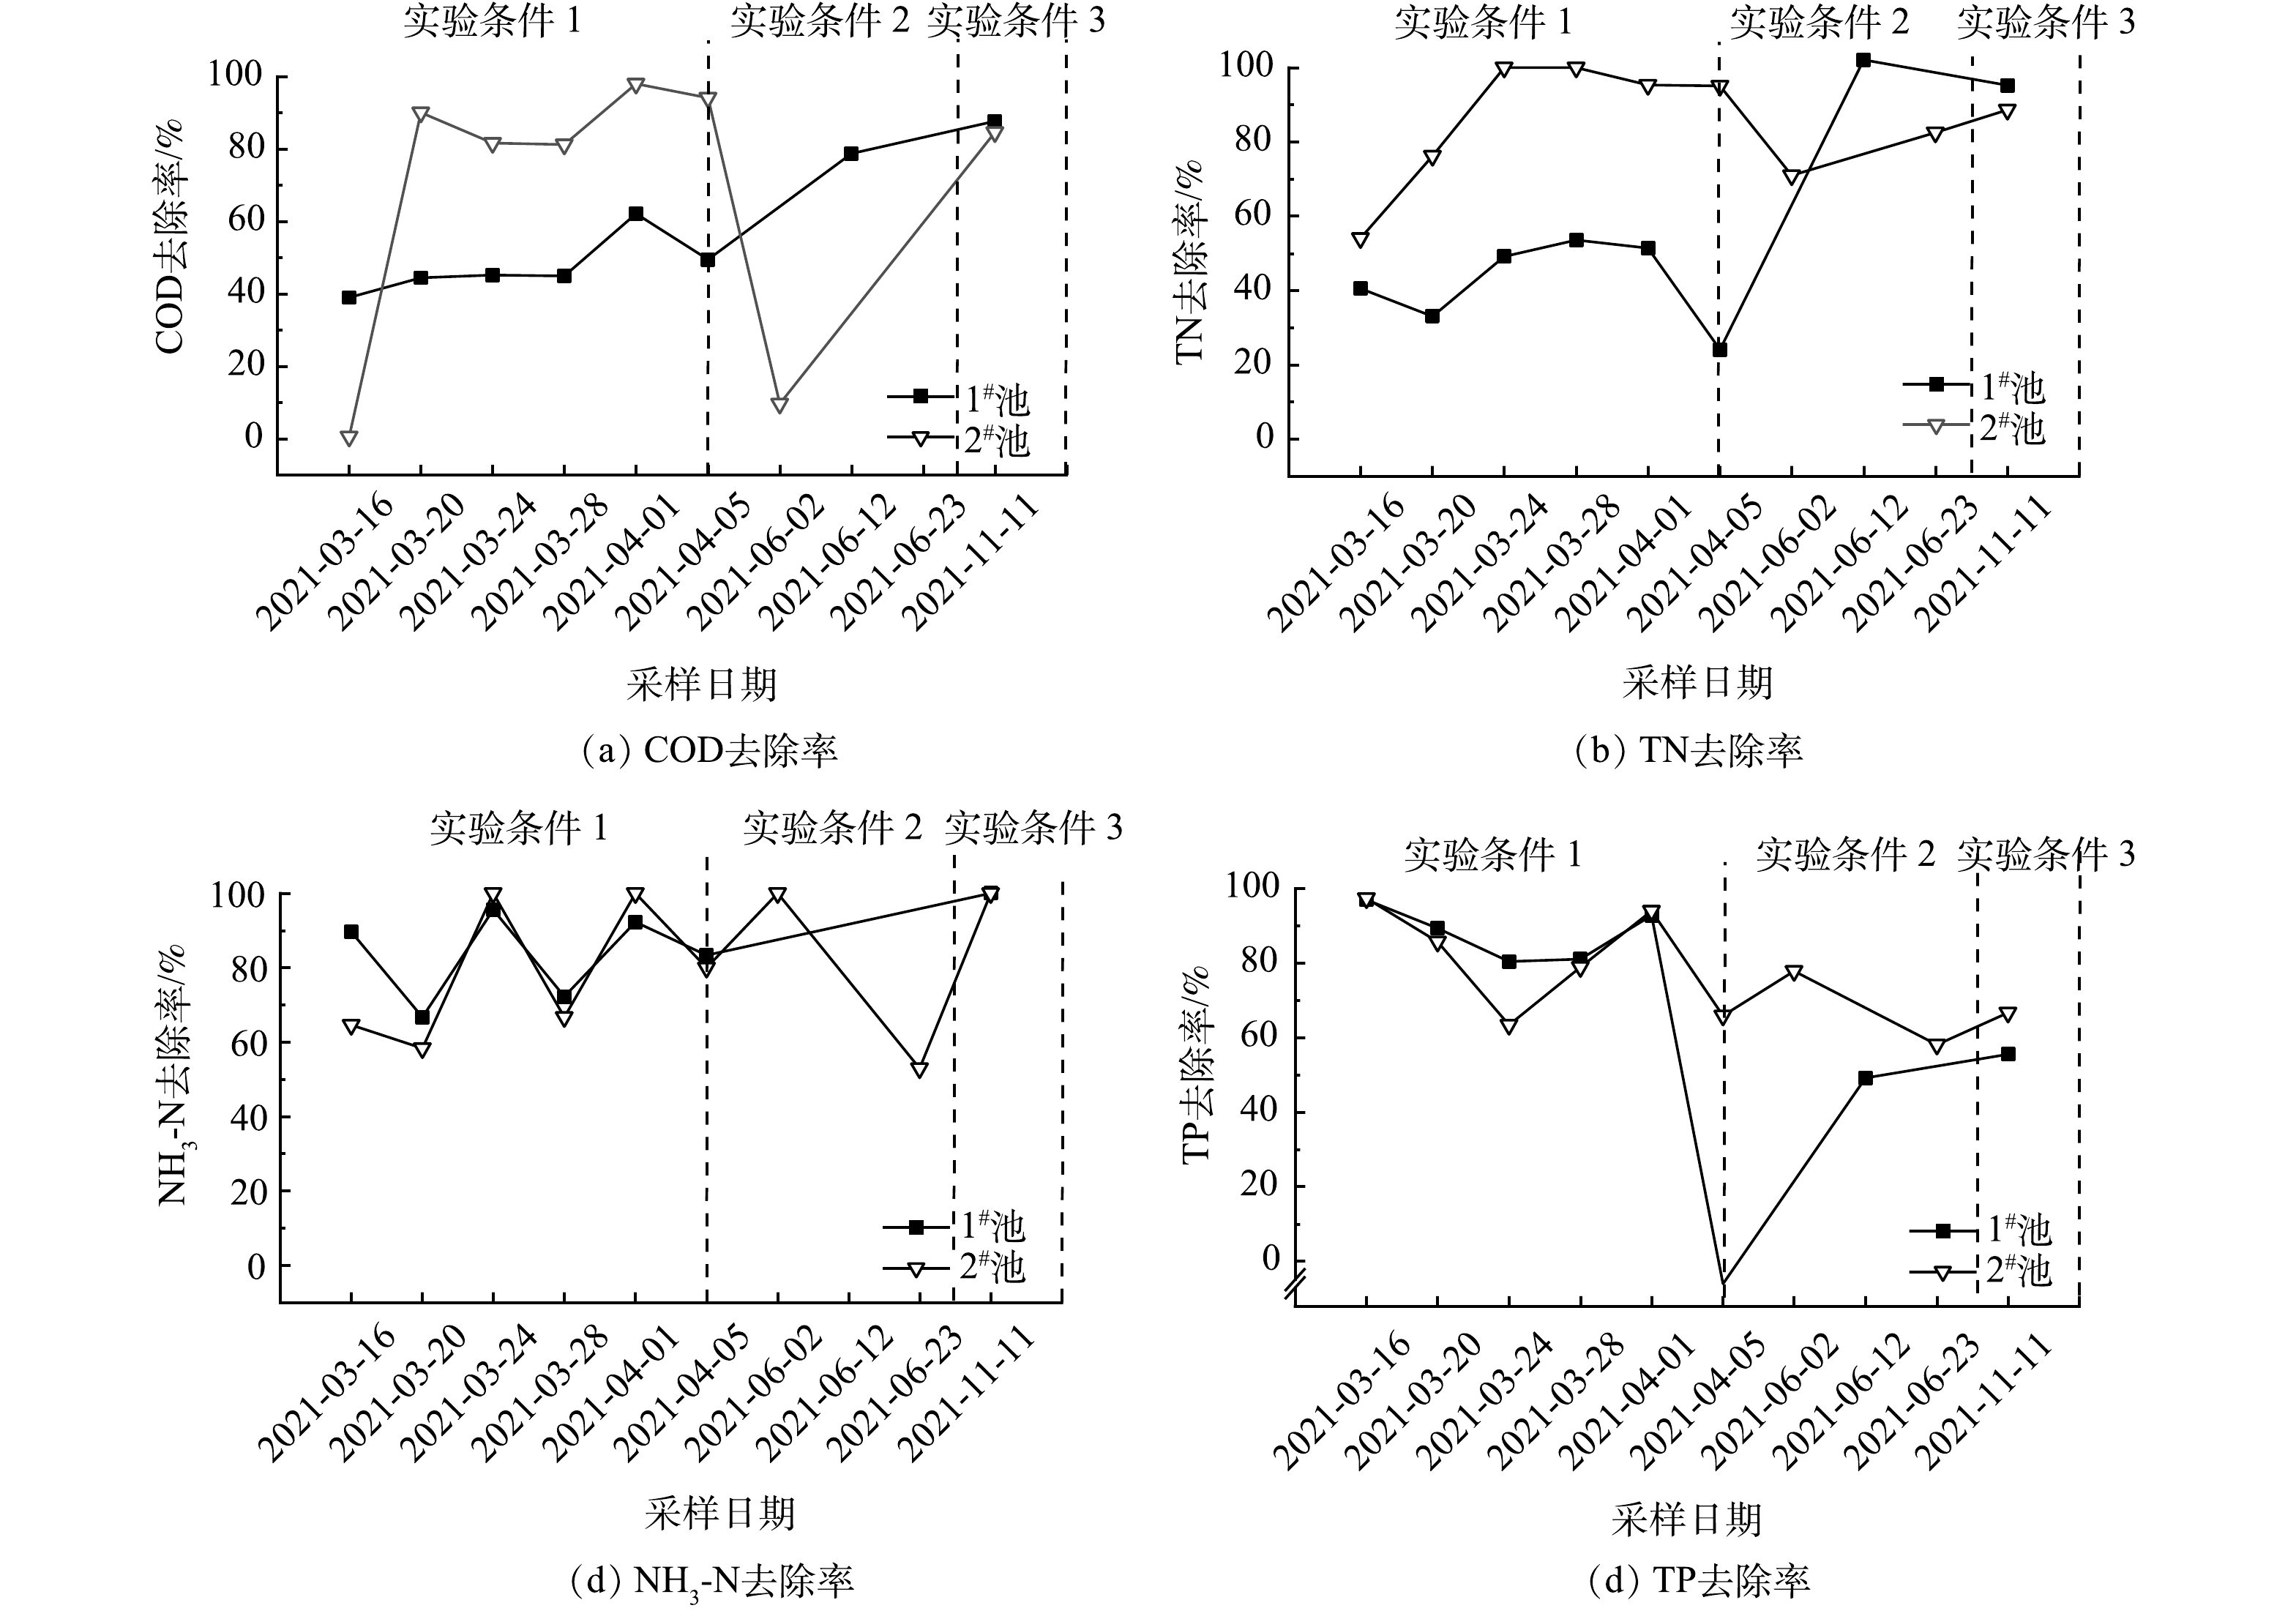 图 4 生物滞留池对常规污染物去除率随时间变化情况Figure 4. Changes of conventional pollutants removal rate with time by bioretention columns
2.3 全氟化合物迁移滞留情况分析
1)全氟化合物在生物滞留池中迁移规律。通过分析各出水口PFCs总量可知,1#生物滞留池在6号出水口获得最高去除率(实验条件2),池底出水口PFCs去除率反而明显下降(图5(a)~(b)),其中对PFOA的去除率尤为低下(-279%)。同样地,2#生物滞留池8号出水口达到最高,底部9号出水口PFPeA、PFHxA、PFHpA、PFOS去除率下降,PFBA下降幅度最为明显(图5(c)~(d))。因此,2组生物滞留池对PFCs的去除沿柱深方向呈现先增加后降低的趋势,说明填料层对PFCs结合不稳定,加之生物滞留池排水快速,短时间内微生物降解难以发挥作用。连续降雨情况下,PFCs可能在生物滞留池发生浸出,导致PFCs出水浓度高于进水浓度。就具体物质而言,PFHxA、PFPeA、PFBA、PFHpA去除率接近100%,而PFBA和PFOS的去除率较低(60%),但该差异原因尚不清楚。
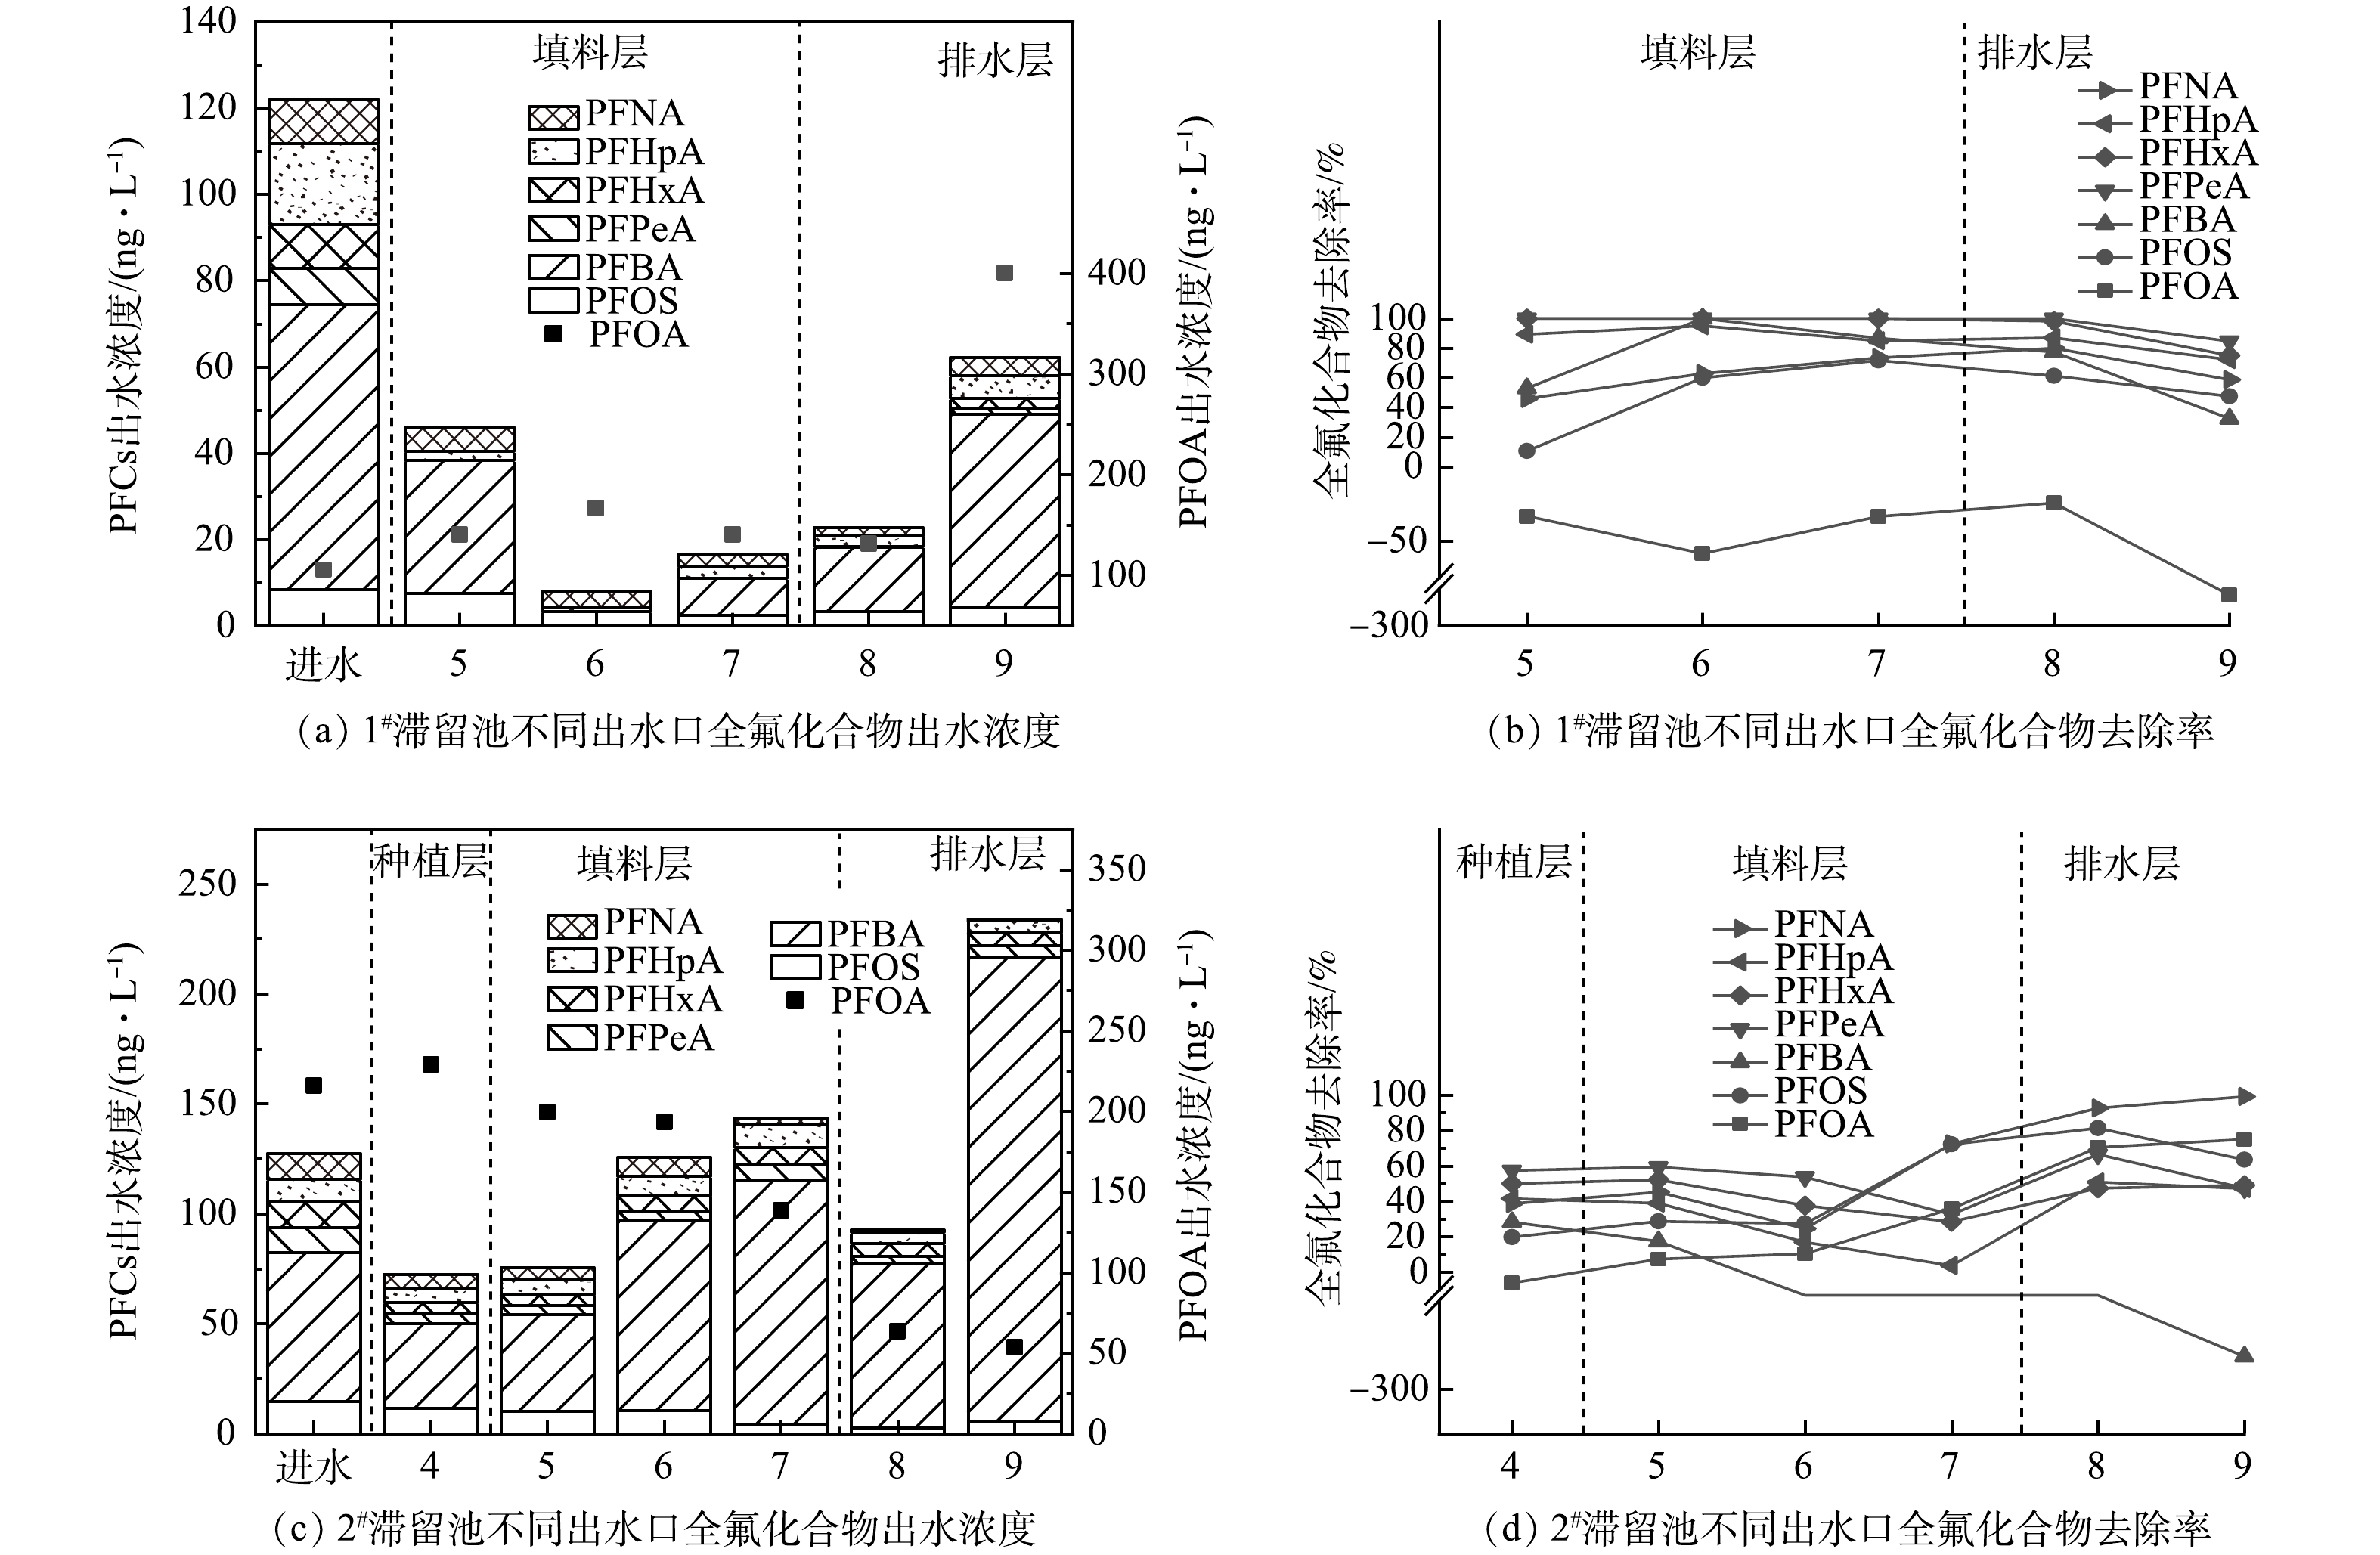 图 5 生物滞留池不同出水口的全氟化合物的去除效果Figure 5. Removal efficiency of perfluorinated compounds at different outlets of bioretention columns
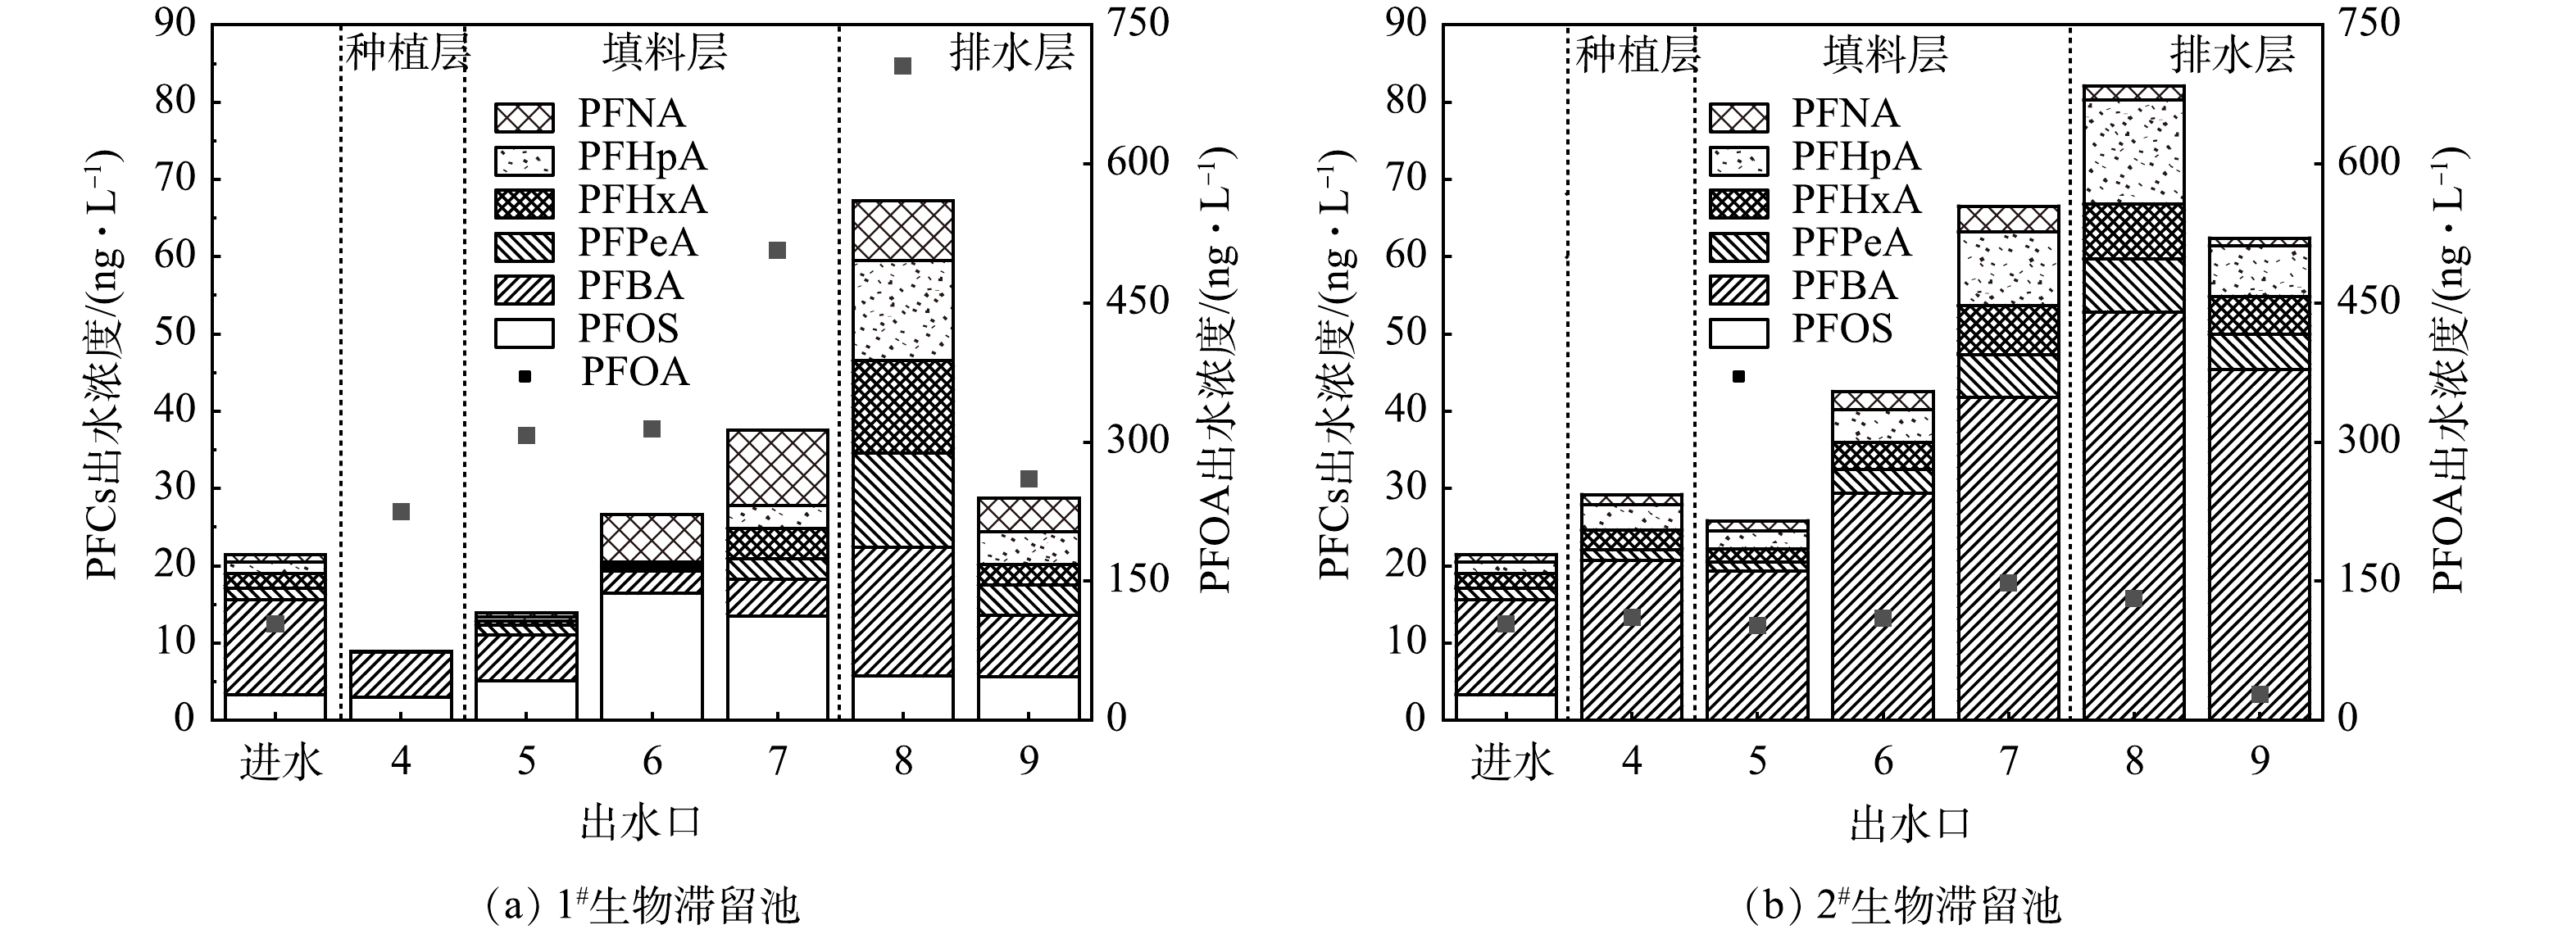
2)全氟化合物在生物滞留池中的浸出情况。生物滞留池在运行近3个月后,为进一步分析PFCs在生物滞留池中的浸出情况,采用加入硫代硫酸钠除氯后的自来水作为进水,测定滞留池各出水口PFCs浓度。由图6(a)可见,1#生物滞留池4号出水口PFOS有明显降低,说明种植层土壤仍对PFCs有截留作用;5~8号出水口PFCs出水浓度呈升高趋势,甚至出现了进水含量较低的PFNA、PFHpA;7号出水口PFHpA的浸出尤为明显;PFOA在8号出水口的出水质量浓度达到705.25 ng·L−1。上述结果证实了PFCs截留在5~8号出水口的填料层,但并未被转化降解。由图6(b)可见,2#生物滞留池中同样存在PFCs浸出情况,但PFOA的浸出量较1#生物滞留池(147.70 ng·L−1)大幅减少,说明煤质活性炭中PFCs不易脱出,运行稳定性更有保障。
3)生物滞留池对全氟化合物去除效果的长期稳定性情况。通过分析2021年3—11月生物滞留池底部出水口PFCs去除率,判断其长期使用潜能。如图7所示,由1#生物滞留池对PFCs去除效能随降雨次数的增加而降低。具体来说,3—4月间PFBA、PFHxA、PFOA和PFOS去除率逐次降低,甚至出现负值即存在浸出现象。但值得注意的是,上述物质去除效能在间隔2个月后得到恢复,推断长时间干旱条件下,PFCs在池内出现了降解转化,释放了填料层的吸附容量,后续需结合微生物实验验证。
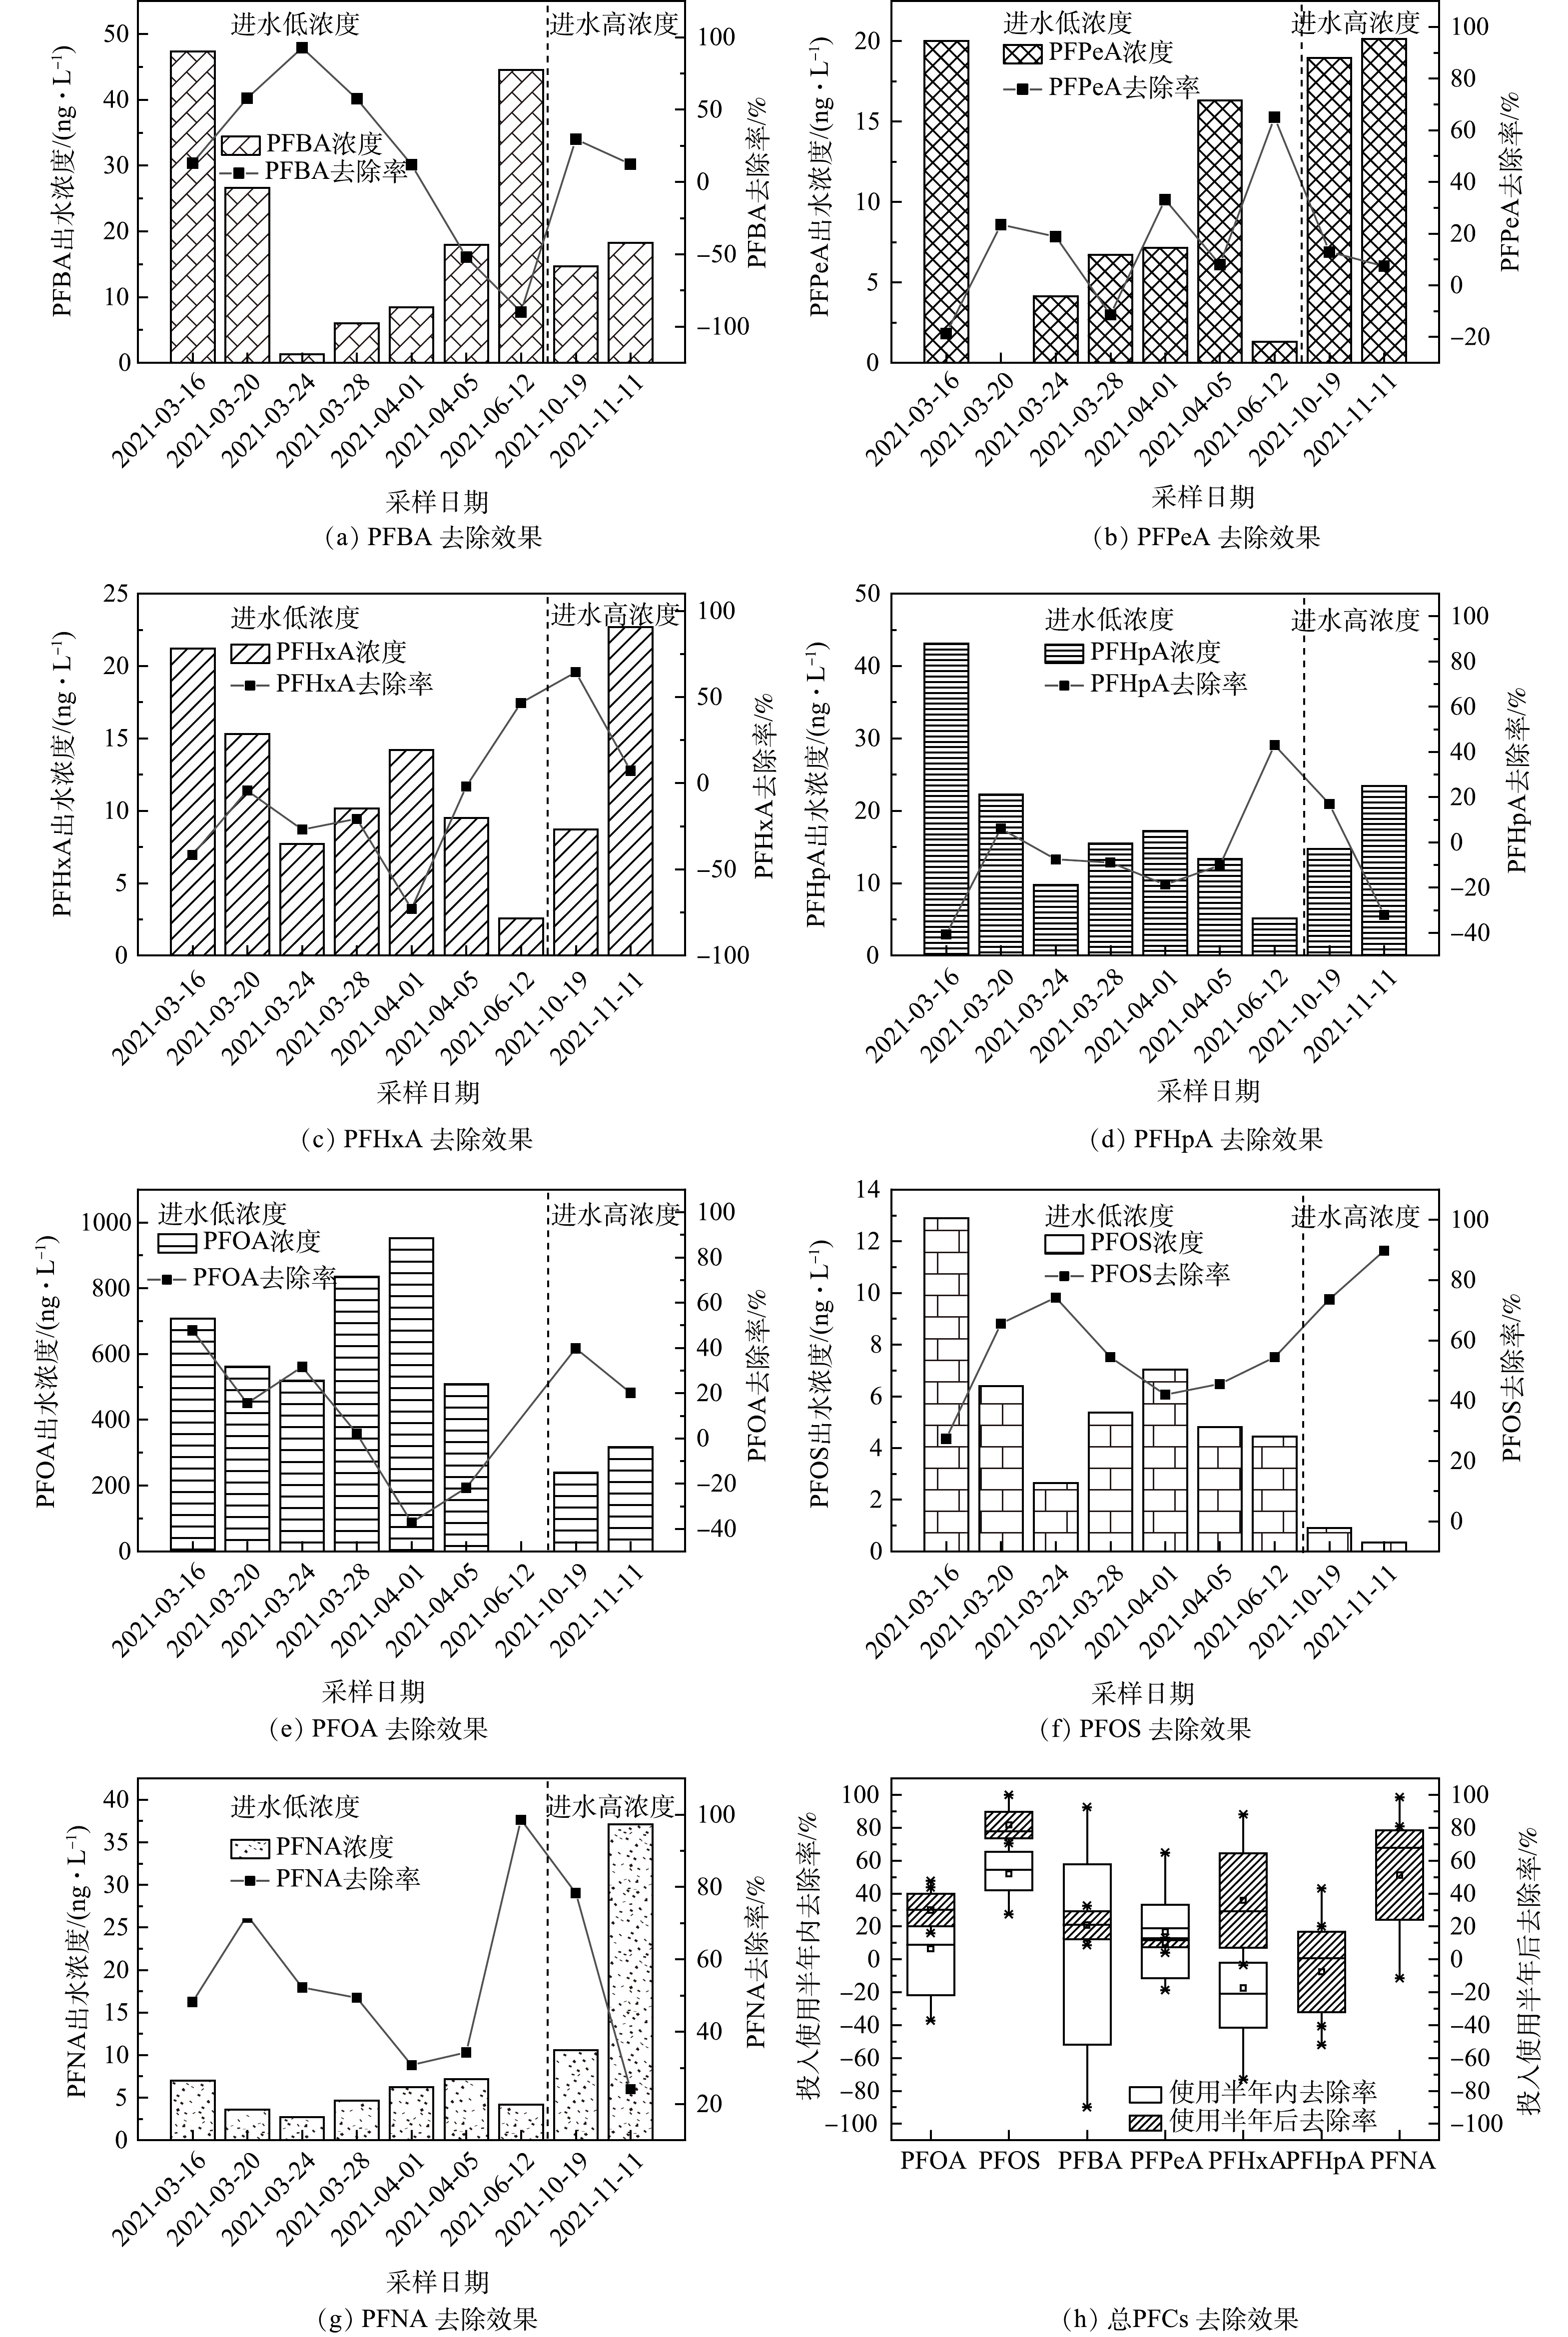 图 7 1#生物滞留池对全氟化合物去除效果随时间变化情况Figure 7. Perfluorinated compounds removal effect with time in 1# bioretention columns
如图8所示,2#生物滞留池对PFCs去除效果远优于1#生物滞留池,说明其具有长期使用的潜能。PFHxA、PFHpA、PFNA、PFOS的去除较稳定(>60%),其中PFOA去除率高于 85%,这个结果印证了煤质活性炭具有高效地吸附去除PFOA的能力[22],PFPeA去除率有一定波动,均值为62.12%。
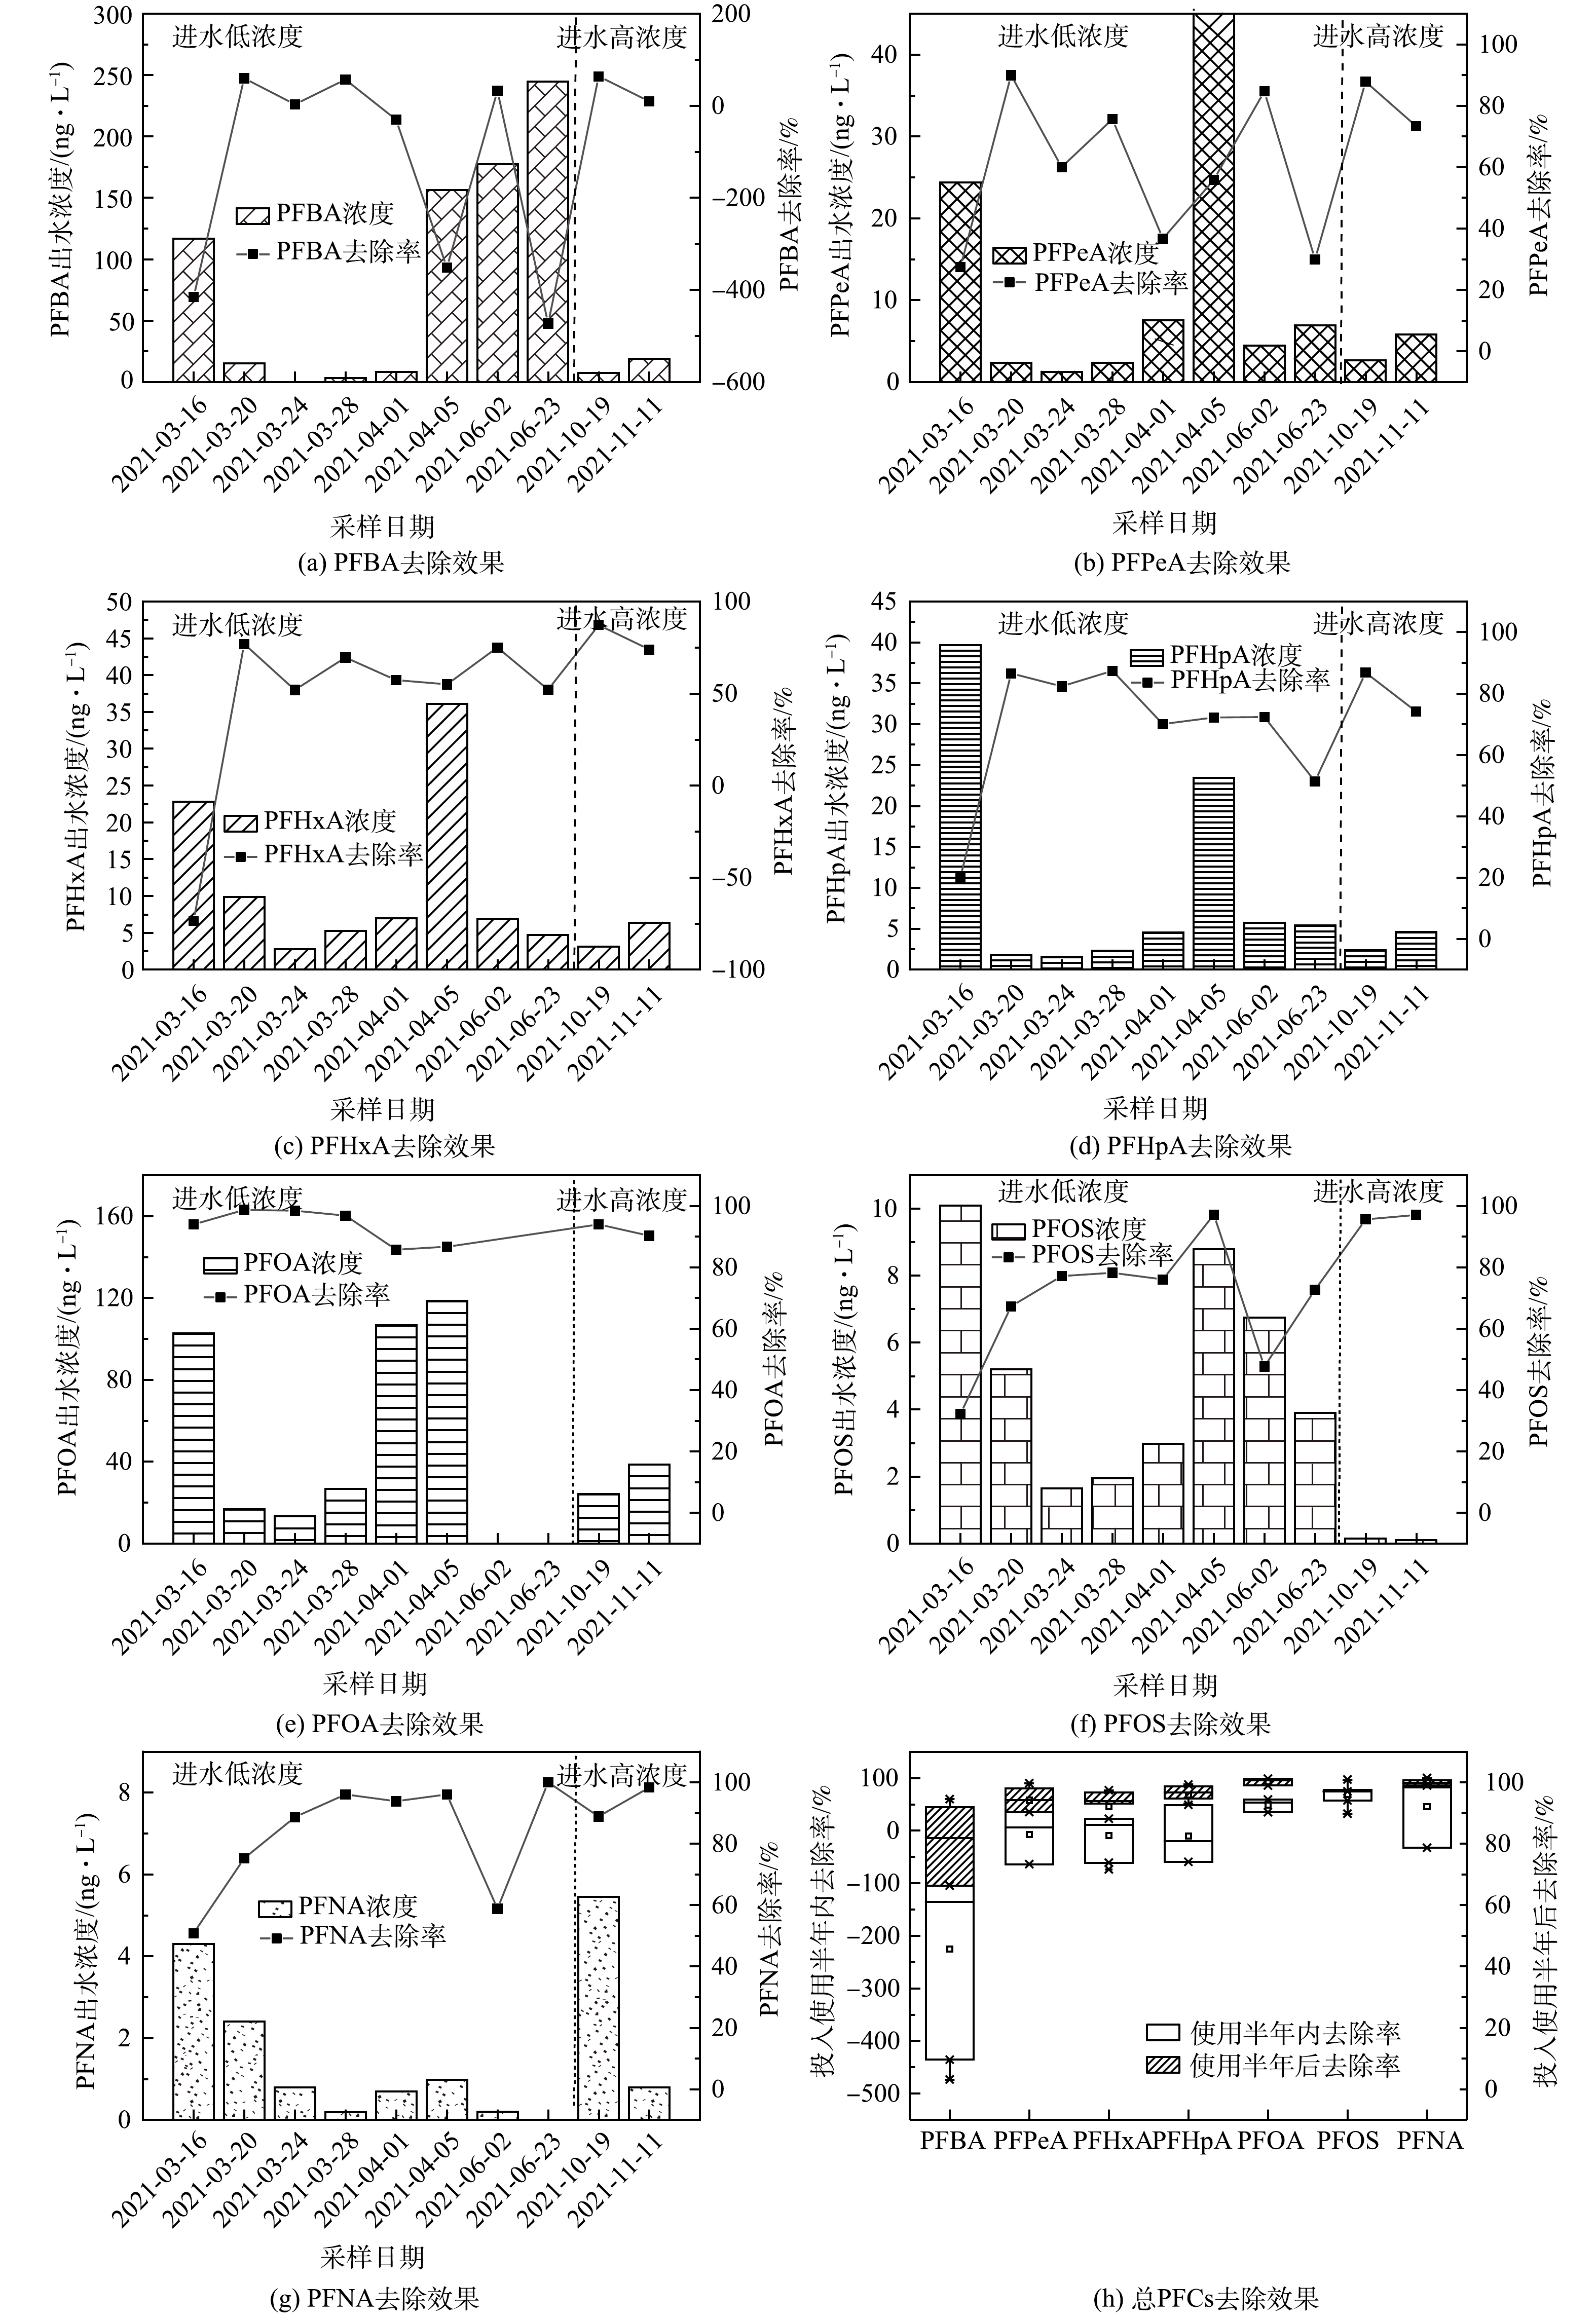 图 8 2#生物滞留池对全氟化合物去除效果随时间变化情况Figure 8. Perfluorinated compounds removal effect with time in 2# bioretention columns
3. 结论
1) 1#生物滞留池对径流水量的平均削减率为(30.3±6.2)%,2#生物滞留池对径流水量的平均削减率为(29.3±10.1)%。随着投入使用时间的延长,2组生物滞留池的水量削减率均呈现波动下降的趋势,其中2#生物滞留池的下降趋势明显。
2) 2组生物滞留池对常规污染物均有较好的去除效果。其中,2#生物滞留池对COD、TP、TOC、TN 的去除率分别为84.6%、62.4%、92.7%、85.6%。生物滞留池对常规污染物的去除主要依靠填料层的吸附作用,但种植层中植物根系与土壤也具备一定的净化能力。在经过将近1 a后,2#生物滞留池对常规污染物仍保持较好的去除效果。
3) PFCs在生物滞留池中浓度分布规律明显。PFBA主要集中于种植层,而PFPeA、PFHxA、PFHpA、PFOA、PFOS、PFNA则更集中于填料层,1#生物滞留池对PFCs的去除效果在0.5 a后由明显下降,而2#生物滞留池对多数PFCs的去除效率还保持在较高的水平,说明其具有长期使用的潜能。
-
[1] Qi H, Li W L, Liu L Y, et al. Brominated flame retardants in the urban atmosphere of Northeast China: Concentrations, temperature dependence and gas-particle partitioning[J]. Science of the Total Environment, 2014, 491-492: 60-66 [2] Gregoris E, Argiriadis E, Vecchiato M, et al. Gas-particle distributions, sources and health effects of polycyclic aromatic hydrocarbons (PAHs), polychlorinated biphenyls (PCBs) and polychlorinated naphthalenes (PCNs) in Venice aerosols[J]. Science of the Total Environment, 2014, 476: 393-405 [3] Li H, Zhou L, Ren M, et al. Levels, profiles and gas-particle distribution of atmospheric PCDD/Fs in vehicle parking lots of a South China metropolitan area[J]. Chemosphere, 2014, 94: 128-134 [4] Kouimtzis T, Samara C, Voutsa D, et al. PCDD/Fs and PCBs in airborne particulate matter of the greater Thessaloniki area, N. Greece[J]. Chemosphere, 2002, 47(2): 193-205 [5] Pankow J F. Review and comparative analysis of the theories on partitioning between the gas and aerosol particulate phases in the atmosphere[J]. Atmospheric Environment (1967), 1987, 21(11): 2275-2283 [6] Bidleman T F. Atmospheric processes[J]. Environmental Science & Technology, 1988, 22(4): 361-367 [7] Pankow J F,Bidleman T F. Effects of temperature, TSP and per cent non-exchangeable material in determining the gas-particle partitioning of organic compounds[J]. Atmospheric Environment. Part A. General Topics, 1991, 25(10): 2241-2249 [8] Pankow J F,Bidleman T F. Interdependence of the slopes and intercepts from log-log correlations of measured gas-particle paritioning and vapor pressure—I. theory and analysis of available data[J]. Atmospheric Environment. Part A. General Topics, 1992, 26(6): 1071-1080 [9] Falconer R L,Bidleman T F. Vapor pressures and predicted particle/gas distributions of polychlorinated biphenyl congeners as functions of temperature and ortho-chlorine substitution[J]. Atmospheric Environment, 1994, 28(3): 547-554 [10] Pankow J F. An absorption model of gas/particle partitioning of organic compounds in the atmosphere[J]. Atmospheric Environment, 1994, 28(2): 185-188 [11] Pankow J F. An absorption model of the gas/aerosol partitioning involved in the formation of secondary organic aerosol[J]. Atmospheric Environment, 1994, 28(2): 189-193 [12] Harner T,Bidleman T F. Octanol-air partition coefficient for describing particle/gas partitioning of aromatic compounds in urban air[J]. Environmental Science & Technology, 1998, 32(10): 1494-1502 [13] Lohmann R, Harner T, Thomas G O, et al. A comparative study of the gas-particle partitioning of PCDD/Fs, PCBs, and PAHs[J]. Environmental Science & Technology, 2000, 34(23): 4943-4951 [14] Goss K U,Schwarzenbach R P. Gas/solid and gas/liquid partitioning of organic compounds: Critical evaluation of the interpretation of equilibrium constants[J]. Environmental Science & Technology, 1998, 32(14): 2025-2032 [15] Simcik M F, Franz T P, Zhang H, et al. Gas-particle partitioning of PCBs and PAHs in the Chicago urban and adjacent coastal atmosphere: States of equilibrium[J]. Environmental Science & Technology, 1998, 32(2): 251-257 [16] Mandalakis M, Tsapakis M, Tsoga A, et al. Gas-particle concentrations and distribution of aliphatic hydrocarbons, PAHs, PCBs and PCDD/Fs in the atmosphere of Athens (Greece)[J]. Atmospheric Environment, 2002, 36(25): 4023-4035 [17] Finizio A, Mackay D, Bidleman T, et al. Octanol-air partition coefficient as a predictor of partitioning of semi-volatile organic chemicals to aerosols[J]. Atmospheric Environment, 1997, 31(15): 2289-2296 [18] Xu M X, Yan J H, Lu S Y, et al. Gas/particle partitioning of atmospheric PCDD/Fs in a satellite town in Eastern China[J]. Chemosphere, 2009, 76(11): 1540-1549 [19] 施泰安, 朱秀华, 许倩, 等. 大连大气中多氯联苯的气粒分配行为[J]. 环境化学, 2013, 32(10): 1874-1884 [20] Lee R G,Jones K C. Gas-particle partitioning of atmospheric PCDD/Fs: Measurements and observations on modeling[J]. Environmental Science & Technology, 1999, 33(20): 3596-3604 [21] 李英明, 江桂斌, 王亚韡, 等. 电子垃圾拆解地大气中二[XCE.tif;%75%75,JZ]英, 多氯联苯, 多溴联苯醚的污染水平及相分配规律[J]. 科学通报, 2008, 53(2): 165-171 [22] Li Y, Jiang G, Wang Y, et al. Concentrations, profiles and gas-particle partitioning of polychlorinated dibenzo-p-dioxins and dibenzofurans in the ambient air of Beijing, China[J]. Atmospheric Environment, 2008, 42(9): 2037-2047 [23] Yang Y, Li D,Mu D. Levels, seasonal variations and sources of organochlorine pesticides in ambient air of Guangzhou, China[J]. Atmospheric Environment, 2008, 42(4): 677-687 [24] Cindoruk S S. Atmospheric organochlorine pesticide (OCP) levels in a metropolitan city in Turkey[J]. Chemosphere, 2011, 82(1): 78-87 [25] Li G, Sun H, Zhang Z, et al. Distribution profile, health risk and elimination of model atmospheric SVOCs associated with a typical municipal garbage compressing station in Guangzhou, South China[J]. Atmospheric Environment, 2013, 76: 173-180 [26] Landlová L, Čupr P, Franc[AKu。D] J, et al. Composition and effects of inhalable size fractions of atmospheric aerosols in the polluted atmosphere: Part I. PAHs, PCBs and OCPs and the matrix chemical composition[J]. Environmental Science and Pollution Research, 2014, 21: 6188-6204 [27] Li J, Zhang G, Guo L, et al. Organochlorine pesticides in the atmosphere of Guangzhou and Hong Kong: Regional sources and long-range atmospheric transport[J]. Atmospheric Environment, 2007, 41(18): 3889-3903 [28] Yenisoy-Karakaş, Öz M,Gaga E O. Seasonal variation, sources, and gas/particle concentrations of PCBs and OCPs at high altitude suburban site in Western Black Sea Region of Turkey[J]. Journal of Environmental Monitoring, 2012, 14(5): 1365-1374 [29] Chrysikou L P, Gemenetzis P G,Samara C A. Wintertime size distribution of polycyclic aromatic hydrocarbons (PAHs), polychlorinated biphenyls (PCBs) and organochlorine pesticides (OCPs) in the urban environment: Street- vs rooftop-level measurements[J]. Atmospheric Environment, 2009, 43(2): 290-300 [30] Chrysikou L P,Samara C A. Seasonal variation of the size distribution of urban particulate matter and associated organic pollutants in the ambient air[J]. Atmospheric Environment, 2009, 43(30): 4557-4569 [31] Lohmann R,Jones K C. Dioxins and furans in air and deposition: A review of levels, behaviour and processes[J]. Science of the Total Environment, 1998, 219(1): 53-81 [32] Thuan N T, Chi K H, Wang S H, et al. Atmospheric PCDD/F measurement in Taiwan and Southeast Asia during Dongsha Experiment[J]. Atmospheric Environment, 2013, 78: 195-202 [33] Lohmann R, Lee R G, Green N J, et al. Gas-particle partitioning of PCDD/Fs in daily air samples[J]. Atmospheric Environment, 2000, 34(16): 2529-2537 [34] Raun L H, Correa O, Rifai H, et al. Statistical investigation of polychlorinated dibenzo-p-dioxins and dibenzofurans in the ambient air of Houston, Texas[J]. Chemosphere, 2005, 60(7): 973-989 [35] Qin S, Zhu X, Wang W, et al. Concentrations and gas-particle partitioning of PCDD/Fs in the urban air of Dalian, China[J]. Chinese Science Bulletin, 2012, 57(26): 3442-3451 [36] Gunes G,Saral A. Seasonal variation of PCDD/Fs in the metropolis of Istanbul, Turkey[J]. Environmental Science and Pollution Research, 2014: 1-12 [37] Chuang S C, Chen S J, Huang K L, et al. Gas/particle partitioning of dioxins in exhaust gases from automobiles[J]. Aerosol and Air Quality Resarch, 2010, 10(5): 489-496 [38] Kaupp H,McLachlan M S. Distribution of polychlorinated dibenzo-p-dioxins and dibenzofurans (PCDD/Fs) and polycyclic aromatic hydrocarbons (PAHs) within the full size range of atmospheric particles[J]. Atmospheric Environment, 2000, 34(1): 73-83 [39] Oh J E, Chang Y S, Kim E J, et al. Distribution of polychlorinated dibenzo-p-dioxins and dibenzofurans (PCDD/Fs) in different sizes of airborne particles[J]. Atmospheric Environment, 2002, 36(32): 5109-5117 [40] Chao M R, Hu C W, Ma H W, et al. Size distribution of particle-bound polychlorinated dibenzo-p-dioxins and dibenzofurans in the ambient air of a municipal incinerator[J]. Atmospheric Environment, 2003, 37(35): 4945-4954 [41] Gambaro A, Manodori L, Moret I, et al. Determination of polychlorobiphenyls and polycyclic aromatic hydrocarbons in the atmospheric aerosol of the Venice Lagoon[J]. Analytical and Bioanalytical Chemistry, 2004, 378(7): 1806-1814 [42] Castro-Jiménez J, Dueri S, Eisenreich S, et al. Polychlorinated biphenyls (PCBs) in the atmosphere of sub-alpine northern Italy[J]. Environmental Pollution, 2009, 157(3): 1024-1032 [43] Han W, Feng J, Gu Z, et al. Polychlorinated biphenyls in the atmosphere of Taizhou, a major e-waste dismantling area in China[J]. Journal of Environmental Sciences, 2010, 22(4): 589-597 [44] Xu Q, Zhu X, Henkelmann B, et al. Simultaneous monitoring of PCB profiles in the urban air of Dalian, China with active and passive samplings[J]. Journal of Environmental Sciences, 2013, 25(1): 133-143 [45] Cindoruk S S,Tasdemir Y. Ambient air levels and trends of polychlorinated biphenyls at four different sites[J]. Archives of Environmental Contamination and Toxicology, 2010, 59(4): 542-554 [46] Kim D G, Choi K I,Lee D H. Gas-particle partitioning and behavior of dioxin-like PCBs in the urban atmosphere of Gyeonggi-do, South Korea[J]. Atmospheric Research, 2011, 101(1): 386-395 [47] Chen S J, Hsieh L T,Hwang P S. Concentration, phase distribution, and size distribution of atmospheric polychlorinated biphenyls measured in southern Taiwan[J]. Environment International, 1996, 22: 411-423 [48] Strandberg B, Dodder N G, Basu I, et al. Concentrations and spatial variations of polybrominated diphenyl ethers and other organohalogen compounds in Great Lakes air[J]. Environmental Science & Technology, 2001, 35(6): 1078-1083 [49] Chen L G, Mai B X, Bi X H, et al. Concentration levels, compositional profiles, and gas-particle partitioning of polybrominated diphenyl ethers in the atmosphere of an urban city in South China[J]. Environmental Science & Technology, 2006, 40(4): 1190-1196 [50] Mandalakis M, Besis A,Stephanou E G. Particle-size distribution and gas/particle partitioning of atmospheric polybrominated diphenyl ethers in urban areas of Greece[J]. Environmental Pollution, 2009, 157(4): 1227-1233 [51] Yang M, Qi H, Jia H L, et al. Polybrominated diphenyl ethers in air across China: Levels, compositions, and gas-particle partitioning[J]. Environmental Science & Technology, 2013, 47(15): 8978-8984 [52] Odabasi M, Bayram A, Elbir T, et al. Investigation of seasonal variations and sources of atmospheric polychlorinated naphthalenes (PCNs) in an urban area[J]. Atmospheric Pollution Research, 2012, 3(4): 477-484 -


 点击查看大图
计量
- 文章访问数: 6164
- HTML全文浏览数: 6163
- PDF下载数: 5796
- 施引文献: 0
