-
珠三角地区是我国改革开放先行示范区,在社会经济发展方面一直走在全国前列,逐步发展成为全国重要增长极和经济增长的重要引擎之一。然而随着区域城市化与工业化的快速发展,水环境治理压力也随之不断增加。虽然通过“珠江综合整治”“南粤水更清行动计划”“水十条”“污染防治攻坚战”等治污措施的实施,珠三角地区水环境质量得到了较大改善,但局部区域现状水环境质量仍不容乐观[1],水环境质量状况与美丽中国、美丽广东建设的目标要求仍有差距。
数学统计分析方法已广泛应用于研究流域水质时空变化和污染源解析,目前已有应用的分析方法主要包括聚类分析[2]、主成分分析[3]、多元线性回归分析[4]等,其中聚类分析和主成分分析能够较为准确地揭示水质的时空变化趋势,识别主要污染因子[5],是水质分析过程中经常使用的研究手段和方法。此外污染负荷对水质的影响是一个很重要的方面,污染负荷核算是分析污染来源、制定控制策略的重要基础[6-8],目前污染负荷核算方法包括排污系数法[9-10]、输出系数法[11]、模型法[12-13]及监测法[14]等,其中排污系数法计算简便,可操作性强[15]。本研究以珠三角典型小流域——高明河流域为例,采用聚类分析和主成分分析水质时空分布规律,识别主要污染因子,分析污染特征,并采用排污系数法估算高明河流域污染负荷,综合分析污染物驱动因子,以期为流域水质改善和水环境管理提供决策依据。
-
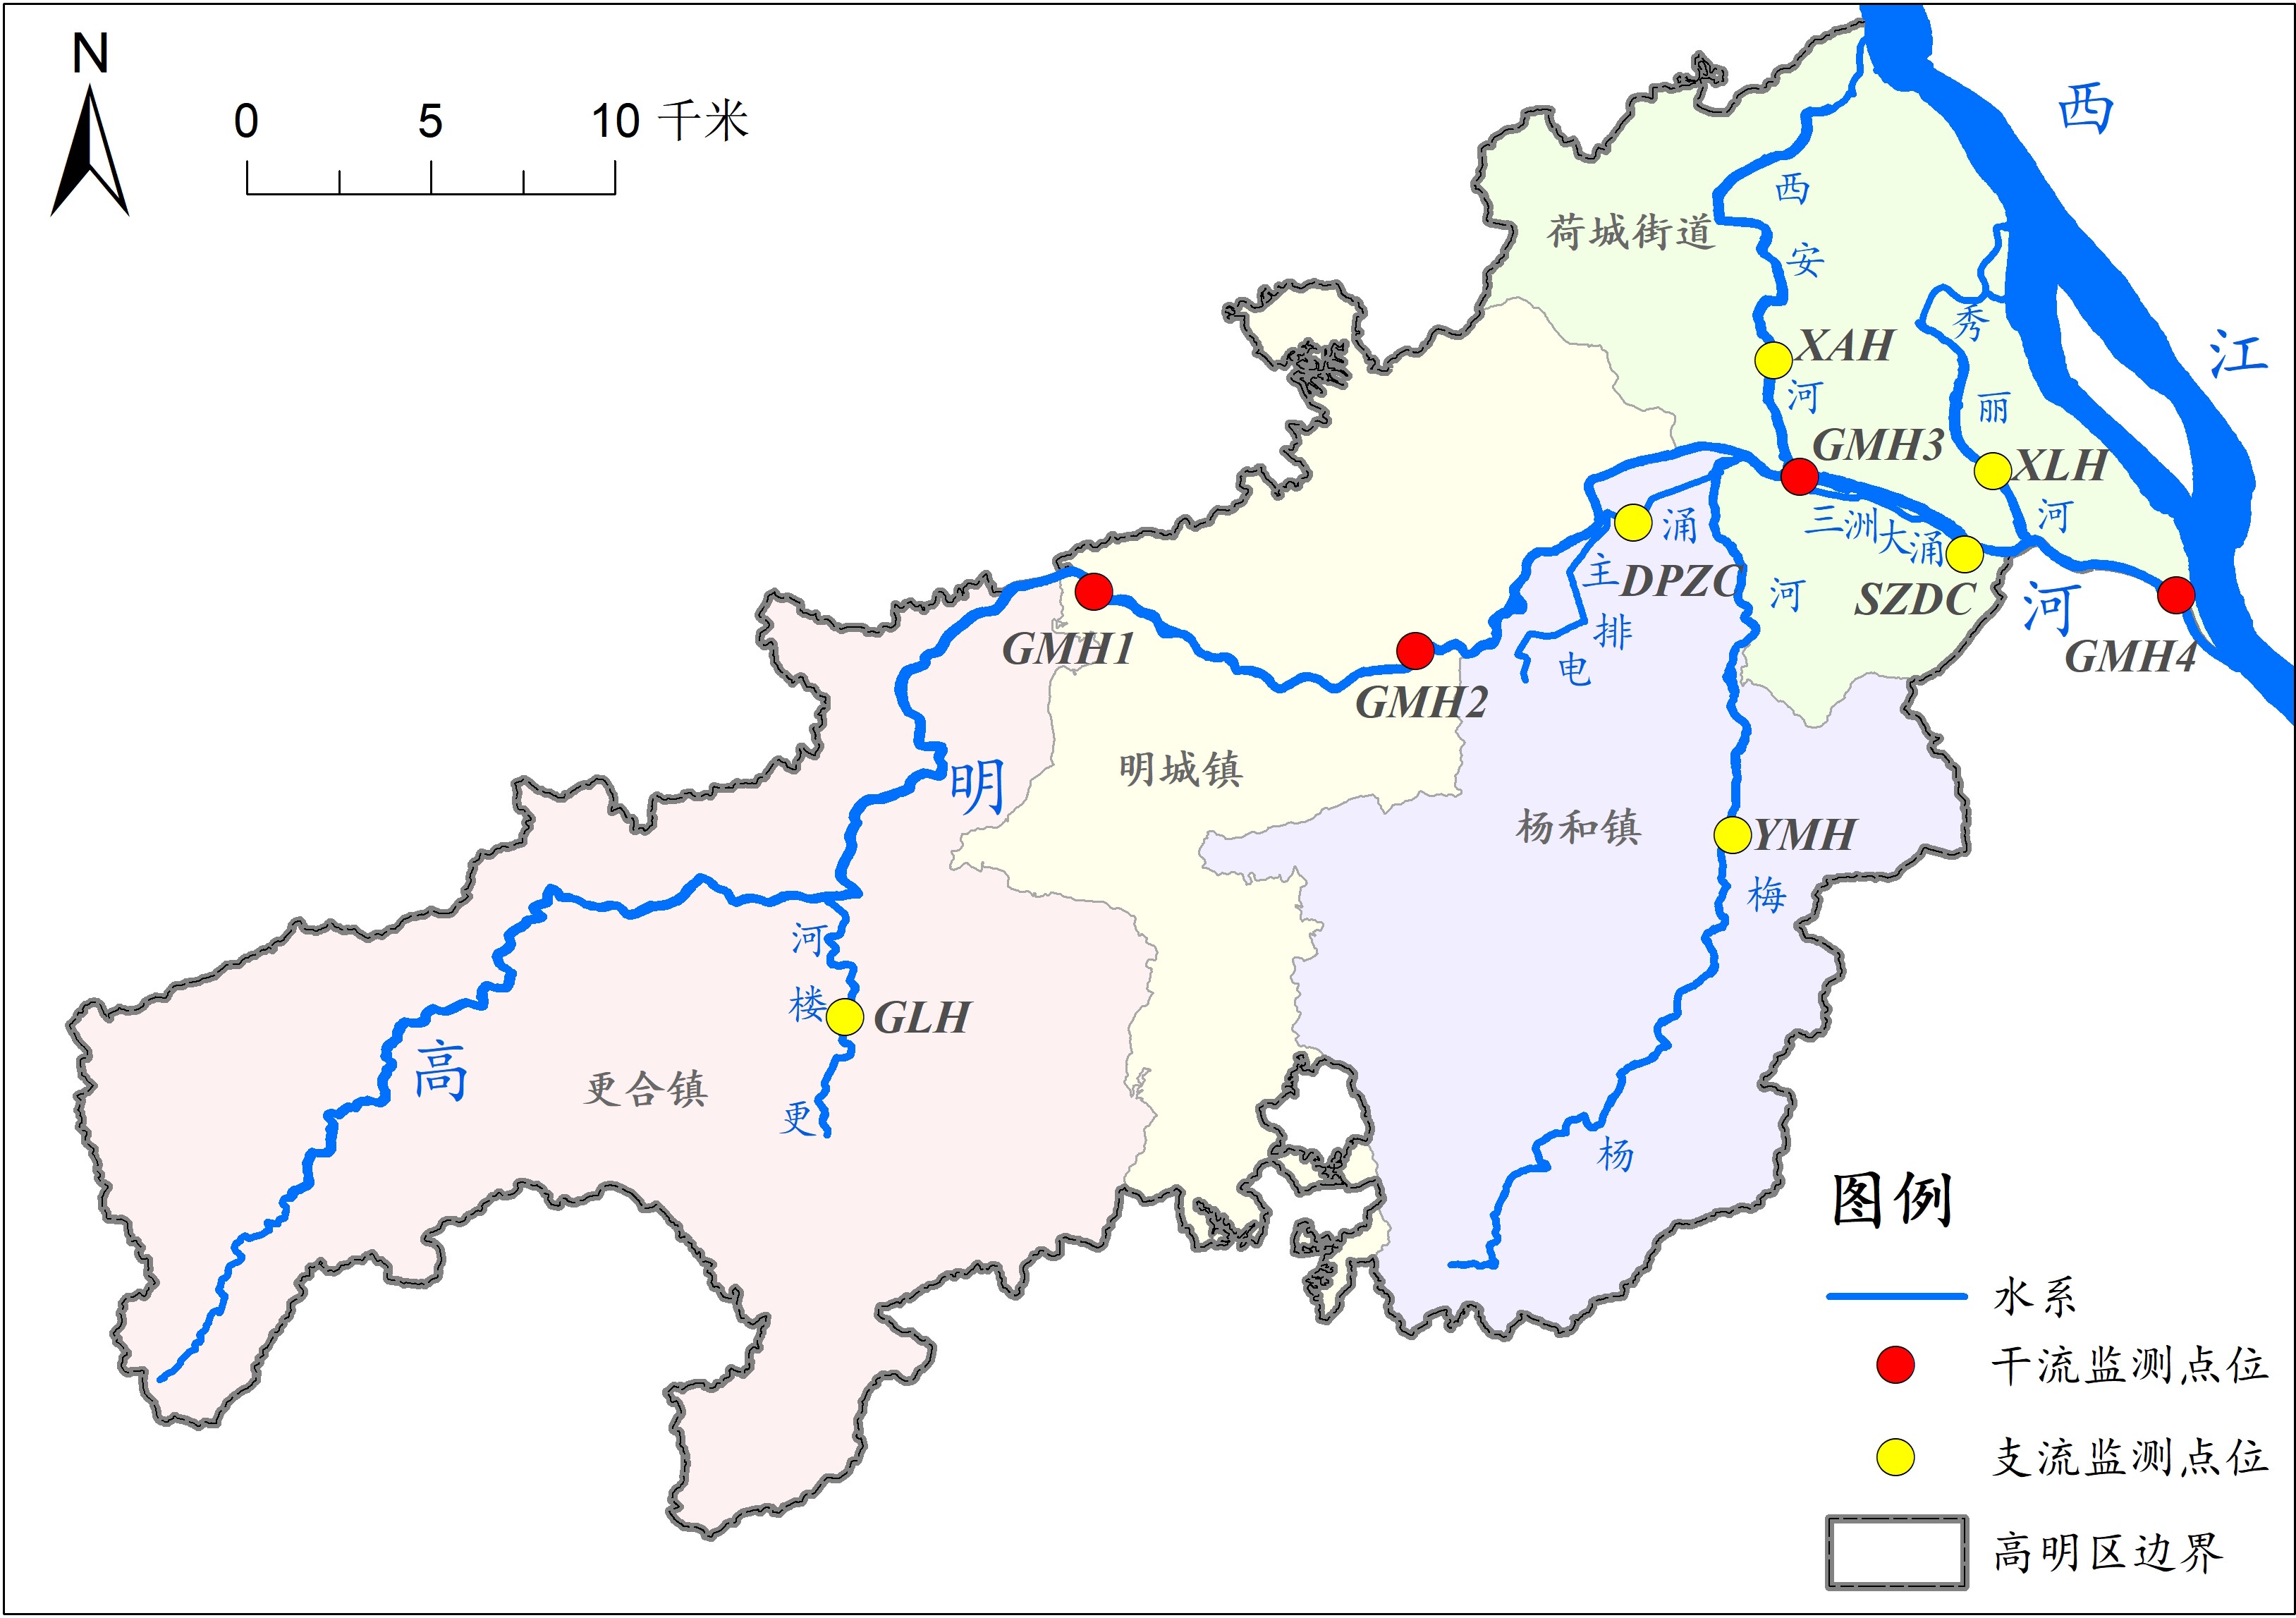
高明河,又名沧江河,发源于佛山市高明区西部合水镇托盘顶,主干流流经高明、南海两个区后于海口碑汇入西江,全长82.4 km,多年平均径流量7.84亿m3。本文研究区域主要为高明河流域高明区境内,面积938 km2,占全流域面积的86%。该区域位于广东省中部,处于112°22′34″E~112°55′06″E、22°38′46″N~23°01′05″N。地势自西南向东北倾斜,东北部地区属西江冲积平原区,西南部地势较高,中部北部属于低山丘陵地区。高明河平均流速为0.2~0.3 m/s,多年平均径流量约为24 m3/s,上游属山谷型河流,流量季节性变化较大,下游地势平坦,受潮汐影响较大,水流方向不定。行政区域包括更合、明城、杨和3个乡镇及荷城1个街道,人口46.9万,主要支流有更楼河、杨梅河、西安河、秀丽河等。本研究选取10个常规监测点,各监测点位置,见图1。
-
水质数据来源于高明区2020年逐月水质监测数据,监测指标包括溶解氧(DO)、高锰酸盐指数(CODMn)、化学需氧量(CODCr)、五日生化需氧量(BOD5)、氨氮(NH3-N)、总磷(TP)6项。参照《地表水环境质量评价办法(试行)》[16]采用单因子评价法评价干支流断面水质类别及等级。
-
聚类分析通过在变量之间定义相似系数,代表变量之间接近程度或相似程度。它通过相似程度的大小,将变量进行分类,形成一个表达相似程度的谱系图。流域水质评价中常通过监测点位的地理位置进行聚类,分析流域水质的时空变化特征[17]。
-
主成分分析是一种利用降维思想,将多个具有一定相关性的指标通过一定的数学方法重新组合成少数几个相互独立的综合指标的多元统计分析方法。这些综合指标能够反映原始指标所包含的大部分信息,在力保原始数据丢失最少的情况下,对高维变量空间进行降维,以保证进一步分析的准确性[18]。本研究应用SPSS软件对6个水质指标进行主成分分析。
-
以2020年为基准年,针对计算各类污染源排污量的方法和参数需求,采用以实地调研和资料收集为主的数据获取方式。
(1)工业污染源。根据流域内工业、企业的排污现状调查成果,结合高明区环境统计、入河排污口调查摸底成果等数据资料,对工业污染负荷进行分析计算。
(2)生活源。根据《第二次全国污染源普查生活源产排污系数手册(试用版)》[19]计算城镇生活源和农村生活源污染物产生量,扣除城镇生活污水处理厂、农村生活污水处理设施削减后得到生活源排放量。
(3)农业面源。参照《第二次全国污染源普查产排污系数手册(农业源)》[20]计算畜禽养殖、水产养殖各项污染物排放量及种植业面源N、P流失量,种植业面源COD流失量参照《全国水环境容量核定技术指南》[21]标准农田法估算。
(4)入河系数。研究区域点源(工业源、城镇生活源)污水经处理后直接排入地表水,污染物入河系数取1。非点源污染源中,农村生活、畜禽养殖源、水产养殖源和种植业面源入河系数视实际情况分别取值0.7、0.5、0.7和0.3,由此计算入河量。
-
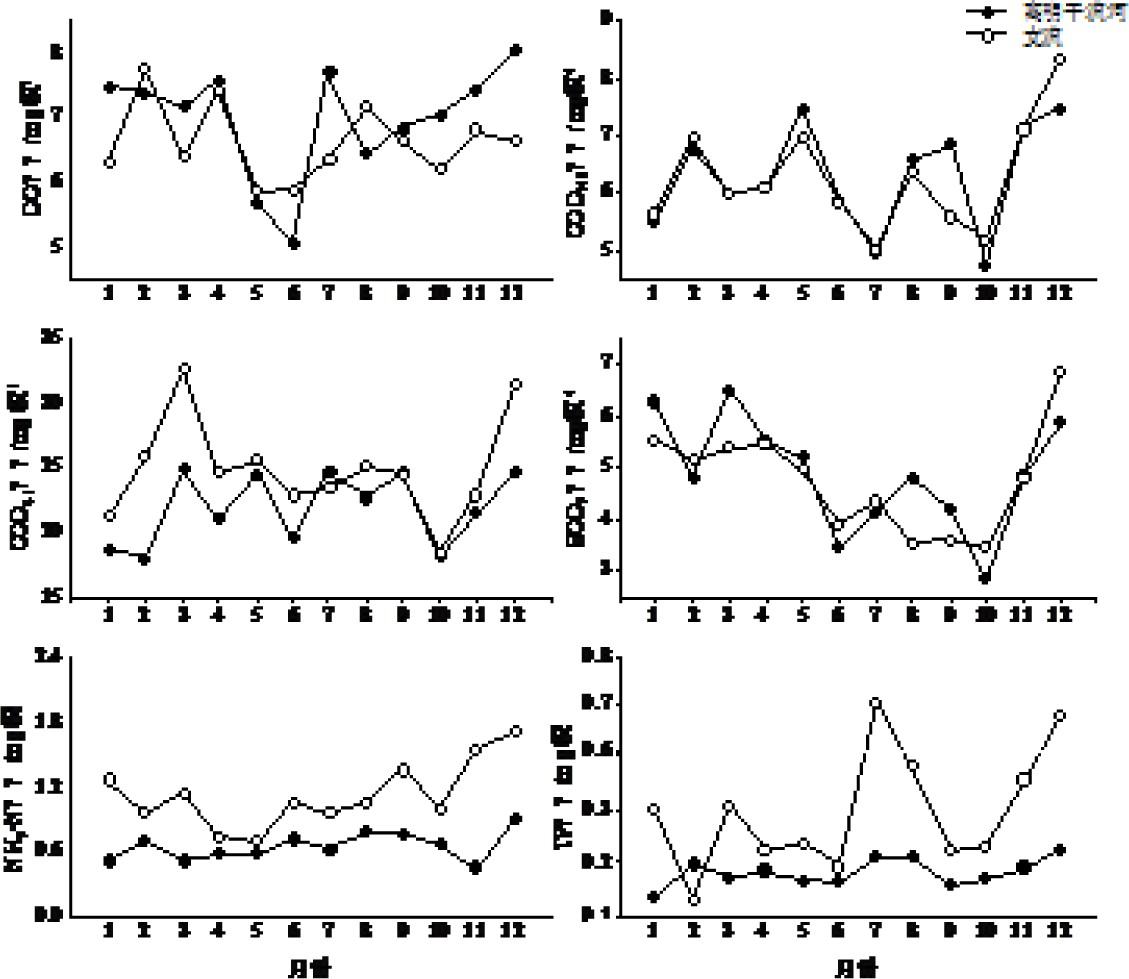
2020年高明河干支流污染物浓度月度变化趋势,见图2。
DO、BOD5、NH3-N呈现先下降后上升趋势,CODMn、CODCr、TP呈现先升高后降低再升高的波动趋势。高明河干流及支流的DO均值分别为(6.96±1.52) mg/L、( 6.63±1.98) mg/L,峰值分别出现在12和2月;CODMn均值分别为( 6.26 ±1.64) mg/L、(6.26± 2.71) mg/L,峰值均出现在12月;CODCr浓度均值分别为( 24.38 ± 7.14) mg/L、( 24.90±11.56) mg/L,峰值均出现在3月;BOD5浓度均值分别为( 4.87±2.24) mg/L、( 4.77 ± 2.73) mg/L,峰值分别出现在3和12月;NH3-N浓度均值分别为( 0.71 ± 0.49 ) mg/L、( 1.12± 1.26) mg/L,峰值均出现在12月;TP浓度均值分别为( 0.19 ± 0.08 ) mg/L、( 0.33± 0.57) mg/L,峰值分别出现在12和7月。
点源污染往往受季节性变化和降水量影响较小,而非点源污染则随雨季降雨径流的增加而明显增加[22]。河流中某污染物以点源污染为主时,其旱季浓度明显高于雨季,以非点源为主时,其雨季浓度明显高于旱季,该规律可用作判断污染物主要来自点源还是非点源的依据[23-24]。高明河干支流NH3-N浓度旱季显著高于雨季(P<0.05),而CDOMn、CODCr、BOD5和TP浓度在雨季和旱季没有显著差异,可以认为高明河流域NH3-N主要来源于点源,而COD和TP来自点源和非点源污染的共同输入,来源较为复杂。
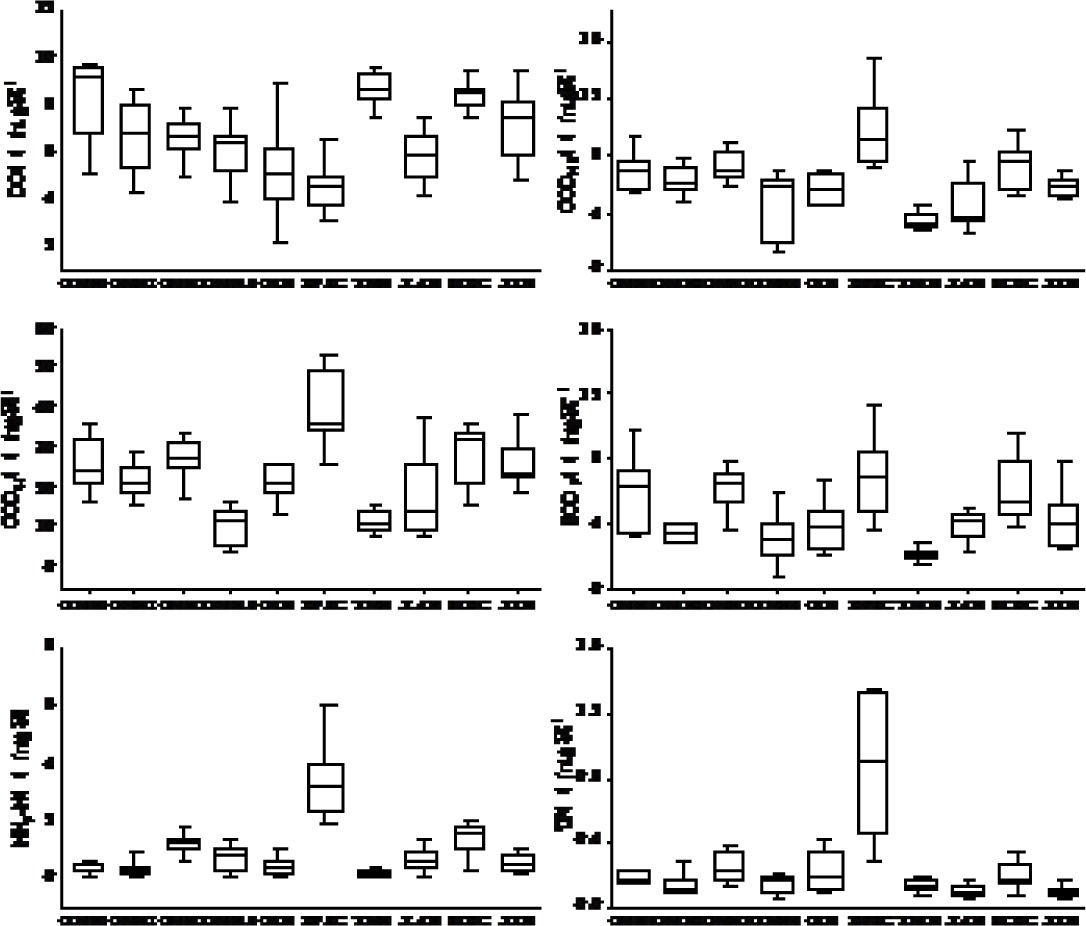
从水质空间分布来看,2020年高明河上游水质Ⅳ类,属轻度污染,污染因子为CODCr;下游水质Ⅲ~Ⅴ类,属良好至中度污染,主要污染因子为CODCr、NH3-N、TP。6条支流中,杨梅河水质良好;更楼河、西安河、秀丽河轻度污染,主要污染因子为CODCr、BOD5)TP;三洲大涌中度污染,主要污染因子为BOD5;电排主涌重度污染,主要污染因子为TP、NH3-N、COD。高明河干流CODMn、CODCr、BOD5和TP沿程均呈现先下降再上升再下降趋势,而DO和NH3-N整体下游浓度高于上游;各支流中,电排主涌污染物浓度明显高于其他支流,见图3。
-
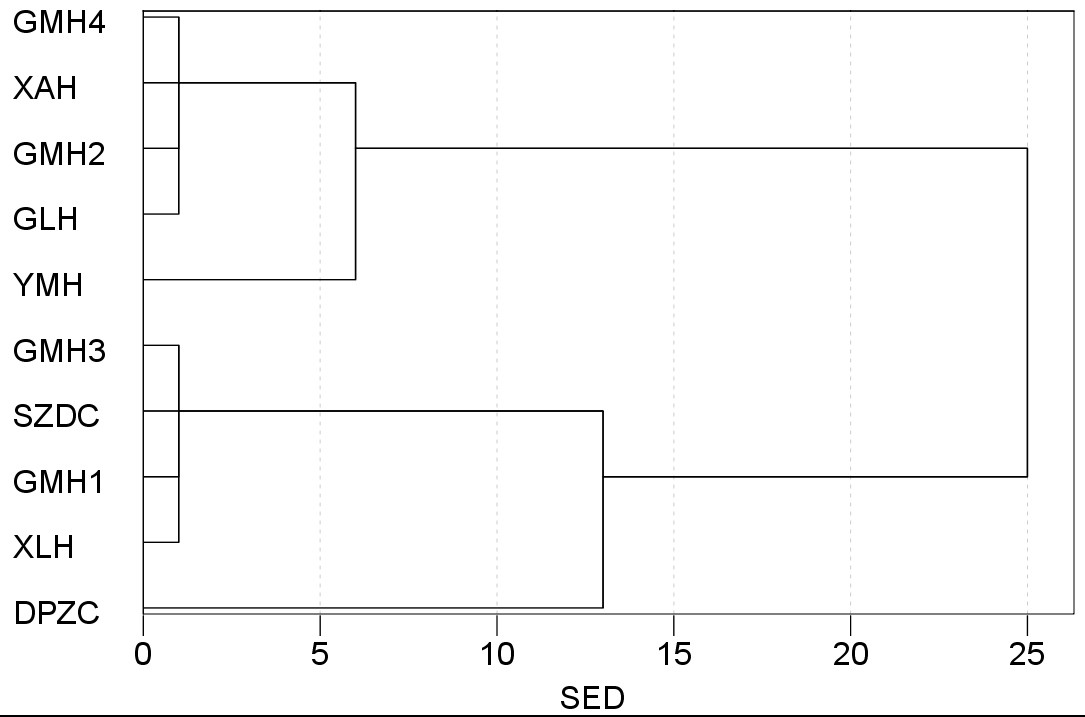
采用最小方差(Ward)对10个监测点位进行空间聚类分析,欧式距离平方(SED)越小,聚类结果越显著[25],当SED=5时,10个断面可以聚类为4组,见图4。
第1组为DPZC,位于支流电排主涌,水质劣Ⅴ类,污染严重;第2组为GMH1、GMH3、XLH、SZDC,主要位于高明河上游、电排主涌汇入口下游,及支流三洲大涌、秀丽河,水质Ⅳ~Ⅴ类;第3组为GMH2、GMH4、GLH、XAH,主要位于高明河中下游及支流更楼河、西安河,水质相对较好,属Ⅲ~Ⅳ类,第4组为YMH,位于支流杨梅河,水质清洁。结合时空特征的分析结果,流域水质空间差异显著,从干流来看,干流上游畜禽养殖分布较多,受畜禽养殖污染影响水质较差,随着污染物沿程降解及周边小支流汇入稀释作用,下游GMH2点位污染物浓度有所降低,随后受重污染支流汇入影响,GMH3点位水质出现恶化,下游受西江潮汐顶托影响,GMH4点位水质有所改善;从支流来看杨梅河水质清洁,更楼河、西安河水质相对较差,略劣于Ⅲ类,三洲大涌、秀丽河水质Ⅳ类,接近Ⅴ类,电排主涌重度污染。
-
采用主成分分析法对高明河流域丰水期(6—9月)、枯水期(12月、1—3月)、平水期(4—5月、10—11月)的水质指标进行分析,丰水期共提取3个组成分,枯水期、平水期均提取2个主成分。丰水期F1、F2、F3贡献率分别为56.64%、20.68%、13.17%,累计贡献率为90.49%;枯水期F1、F2贡献率分别为71.08%、12.26%,累计贡献率为83.34%;平水期F1、F2贡献率分别为66.05%、16.52%,累计贡献率为82.57%。说明提取的主成分可以很好地反映高明河流域各水期的水质信息。各水质指标的主成分载荷矩阵,见表1。
丰水期F1主要包括CODCr、CODMn、BOD5,反映的是有机污染特征;F2和F3主要包括DO。枯水期F1主要包括NH3-N、BOD5、CODMn、TP,同时反映了氮磷元素和有机污染的特征,属于典型的混合源[26],其中NH3-N因子载荷最高;F2主要包括溶解氧。平水期F1主要包括CODMn、TP、CODCr,同时反映了磷元素和有机污染特征;F2主要包括溶解氧。综上可知,2020年高明河流域水质丰水期主要受有机污染影响;枯水期主要受氮元素影响,其次为有机污染和磷元素影响;平水期主要受有机污染和磷元素影响。
-
本研究以COD、NH3-N、TP3种典型污染物为例进行深入的水质驱动力分析,根据核算结果,2020年流域COD、NH3-N和TP入河量分别为8 725.67、548.23和148.31 t,不同类型污染贡献率,见表2。
根据水质主成分分析结果,流域丰水期水质主要受有机污染影响,畜禽养殖源对COD污染影响最大,贡献率达38.38%。2020年高明区全年生猪累计出栏量约11万头,承担了佛山市约一半的生猪供应。从治理情况来看,大部分生猪养殖场采用化粪池、沼气池等厌氧手段对粪污进行处理,经处理后的固体粪污通过还林还田、生产有机肥、第三方处理等方式资源化利用,液体粪污多还林还田或排入鱼塘;鸡等陆禽养殖场均采用干清粪,粪污收集后经第三方处理;鸭、鹅等水禽养殖场粪污排入鱼塘。但部分养殖场粪污治理设施运行效果不佳,排入鱼塘的粪污雨季随鱼塘水溢流对河流水质造成影响。有研究表明,畜禽粪便中有机质含量高[27],可见畜禽养殖是流域丰水期有机污染的主要驱动因子。从空间分布来看,畜禽养殖场主要分布在上游的更合镇,是造成流域上游COD超标的主要原因。
流域枯水期水质受氮磷元素和有机污染综合影响,其中NH3-N因子载荷最高,城镇生活源对NH3-N污染影响最大,贡献率达42.67%。2020年高明区城镇人口约40万人,生活污水产生量约10万m3/d,全区已建成污水处理厂8座,总设计处理能力约23万m3/d,处理能力已远超过生活污水的产生量,但处理能力分布不均,电排主涌汇水范围内两座污水处理厂仍在建设中,周边生活污水未得到有效处理。从各污水处理厂运行数据来看,部分区域城镇污水收集处理提质增效有待加强,生活污水收集处理效率较低是枯水期氮污染的主要驱动因子。此外枯水期水质还受主要来源于畜禽养殖的有机污染影响。
流域平水期水质除了受由畜禽养殖为主要驱动的有机污染和由城镇生活源为主要驱动的氮污染影响外,受磷元素影响也较大。根据污染源核算结果,水产养殖对TP污染影响最大,贡献率达42.14%。高明区水产养殖约10万亩,养殖品种以草鱼、鲮、罗非鱼等为主。从鱼塘空间分布来看,中上游以山塘养殖形式零散分布在高明河、更楼河两岸,下游以鱼塘连片养殖形式分布在西安河、秀丽河、电排主涌、高明河周边。从治理情况来看,2020年高明区已完成约1 km2鱼塘的标准化改造,实现养殖尾水达标排放或循环利用,但仍有很多鱼塘尾水未经处理,而未治理养殖尾水通常伴有过量的肥料和饵料,造成养殖水体及周边自然水生态环境中TP的升高[28-29]。
综上可知,流域污染源主要为畜禽养殖、城镇生活源、水产养殖等。丰水期水质主要受畜禽养殖污染,枯水期主要受城镇生活源污染,其次为畜禽养殖污染,平水期畜禽养殖、水产养殖、城镇生活源均对流域水质有较大影响。
-
(1)2020年高明河水质不能稳定达标,上游主要污染因子为COD,下游主要污染因子为COD、NH3-N、TP。
(2)高明河流域水质空间差异显著,干流水质从上游往下游整体呈先改善再恶化再改善的波动趋势,6条主要支流中杨梅河水质清洁,更楼河、西安河水质相对较差,略劣于Ⅲ类,三洲大涌、秀丽河水质Ⅳ类,接近Ⅴ类,电排主涌重度污染。
(3)丰水期水质主要受畜禽养殖污染,枯水期主要受城镇生活源污染,其次为畜禽养殖污染,平水期畜禽养殖、水产养殖、城镇生活源均对流域水质有较大影响。
(4)建议按照“重点突破、分类治理、流域统筹”的原则,以畜禽养殖、城镇生活、水产养殖源为主,强化流域污染控制,同时坚持干支流协同治理,强化电排主涌等重点支流综合整治,以支流水质持续改善支撑干流断面水质达标。
珠三角某典型小流域水质时空特征及污染驱动力分析
Spatial and temporal characteristics of water quality and pollution driving forces of a typical small watershed in the Pearl River Delta
-
摘要: 采用聚类分析法和主成分分析法,对珠三角地区高明河流域水质指标进行数据分析,并采用排污系数法对流域污染负荷进行估算,剖析流域水质时空分布特征,识别主要污染指标,揭示流域水质与污染源的内在联系。结果表明,2020年高明河水质不能稳定达标,上游主要污染因子为COD,下游主要污染因子为COD、NH3-N、TP。高明河流域水质空间差异显著,干流从上游往下游整体呈先改善再恶化再改善的波动趋势。丰水期流域有机污染严重,来源主要为畜禽养殖;枯水期氮污染严重,来源主要为城镇生活源;平水期水质受氮磷营养盐和有机污染综合影响,其中磷来源主要为水产养殖。因此,为改善高明河流域水质,应重点加强对畜禽养殖、城镇生活源、水产养殖污染源的治理与控制。Abstract: The data of water quality indicators in the Gaoming River Basin was analyzed by cluster analysis and principal component analysis, and the pollution load of the basin was estimated by discharge coefficient method, to dissect the spatial and temporal distribution characteristics of water quality, identify the main pollution indicators, reveal the inner link between water quality and pollution source. The results showed that the water quality of Gaoming River cannot reach the standard in 2020, the main pollution factors of upstream were COD, the main pollution factors of downstream were COD, NH3-N and TP. There were significant spatial differences in water quality of the Gaoming River basin. The main stream from the upstream to the downstream shows a fluctuating trend of improving-deteriorating-improving. The organic pollutants in wet season were serious , and the main source of pollution was livestock breeding. Nitrogen pollutants in dry season were serious, and the main source was urban domestic sewage. The water quality in normal water period was affected by nitrogen and phosphorus nutrients and organic pollutants, and the main source of phosphorus pollution was aquaculture. Therefore, it was necessary to strengthen the control of the pollution sources of livestock breeding, urban domestic sewage and aquaculture to improve the water quality of Gaoming River Basin.
-
我国城镇污水处理厂常年在实际运行过程中会遭受到有机负荷冲击[1-4],进水污染物浓度的突然变化或有机负荷(OLR)冲击会影响生化系统中微生物的生命活动、营养物质的利用及微生物代谢途径,进而影响水中污染物的去除效果[5-6]。我国城镇污水处理厂常用生物工艺为An/O、氧化沟、SBR和MBR等,An/O和SBR为城镇污水厂主要工艺[7],污水厂在运行的过程中常受高有机负荷冲击,生物系统遭受破坏且出水水质不达标,且高有机负荷冲击导致系统长时间处于低溶解氧状态,易造成污泥膨胀。因此如何采取有效的措施应对有机污染物冲击,保证出水水质稳定达标,对于实际工程应用价值更大。
董国日等[8]通过研究连续有机负荷冲击对SBR反应器的影响,当周期有机冲击负荷为0.10 kg COD/(kg MLVSS·h)时,SBR系统能够耐受连续多个周期的高有机负荷冲击。金明姬等[9]通过研究不同有机负荷条件下曝气时间对SBR反应器的影响,当搅拌/曝气时间分别为2.5 h/7.5 h时,COD和TP的去除效果最佳。本文通过改变进水有机负荷的大小,来了解不同有机负荷瞬时冲击对SBR反应器的影响,给出系统自然恢复时间。通过检测进出水COD、NH4+-N、TN、TP和活性污泥胞外聚合物(EPS),并采取提高曝气量的方法探索其对各项污染物的去除效果,以此为工程实践提供理论参数支持。
1. 材料与方法
1.1 试验装置
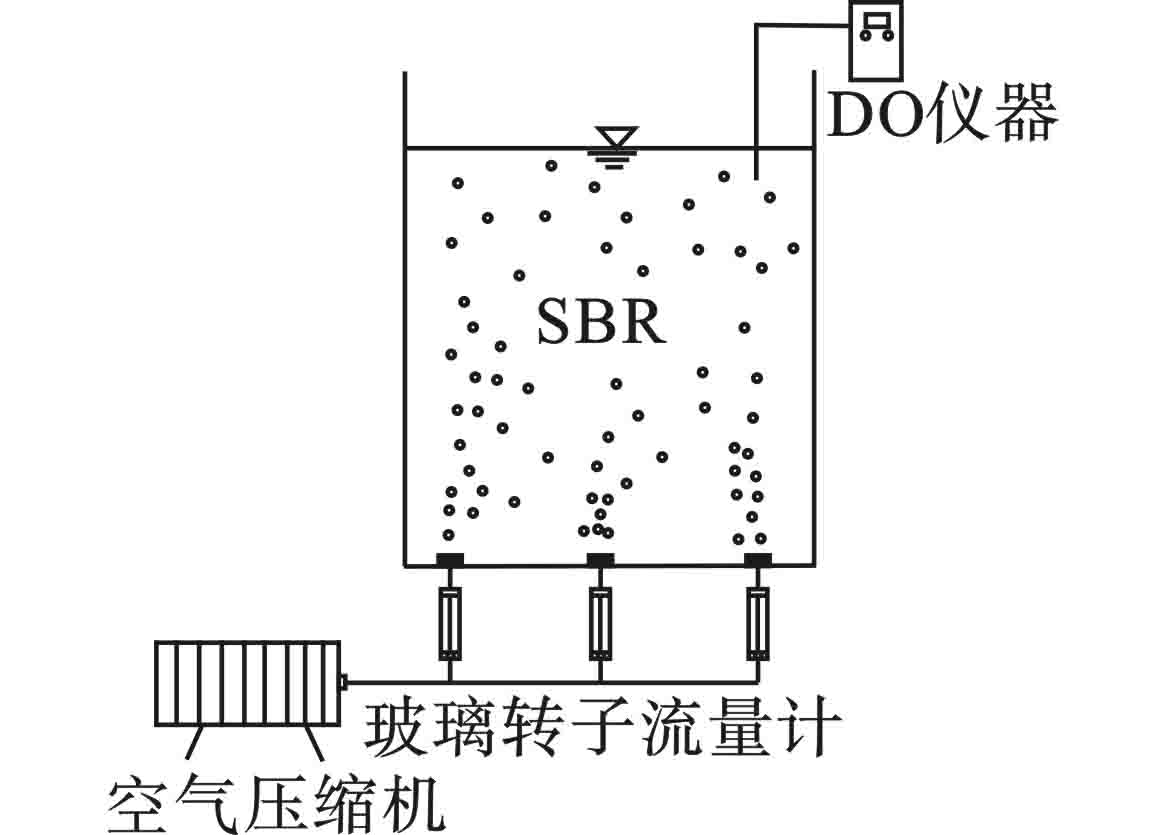
试验装置示意图,见图1。SBR反应器采用有机玻璃板制,300 mm×300 mm×400 mm,总有效容积为36 L。试验期间水温(21±1.5)℃。采用电磁式空气压缩机曝气,使用水泵进水,并用玻璃转子流量计进行气量控制。反应器运行方式:曝气8 h、沉淀3 h、排水10 min、闲置50 min,排水比50%。每个周期12 h,采用非限制性曝气方式。反应器活性污泥来自吉林省柏林水务集团污水厂。
1.2 实验用水
实验污水模拟城镇污水主要成分:淀粉、牛肉膏、蛋白胨、乙酸钠(CH3COONa)、氯化铵(NH4Cl)、磷酸二氢钾(KH2PO4)、碳酸氢钠(NaHCO3)、硫酸镁(MgSO4)、氯化钙(CaCl2)、硫酸亚铁(FeSO4)和微量元素1 mL。其中微量元素成分:氯化锌(ZnCl2)、硫酸铜(CuSO4)、硫酸锰(MnSO4)和氯化铝(AlCl3)。实验期间进水污染物浓度,见表1。
表 1 设计进水主要污染物浓度范围mg·L−1 污染物 常负荷 负荷1 负荷2 负荷3 COD 372.1~427.3 798.2~811.2 1 116.3~1 281.9 1 484.8~1 709.2 NH4+-N 33.53~36.17 TN 38.53~41 TP 3.02~4.17 1.3 试验方法
冲击试验之前反应器已稳定运行30 d,运行期间曝气量1.2 L/min,混合液悬浮固体(MLSS)质量浓度3 500 mg/L,污泥龄30 d,运行期间平均出水COD、NH4+-N、TN和TP分别为28.9、0.43、10.46和0.083 mg/L。反应器运行稳定之后进行单周期瞬时有机负荷冲击试验,实验通过调整淀粉、乙酸钠的量来控制进水有机负荷大小。冲击过程中观察不同负荷下污染物去除变化和污泥特性,给出系统自然恢复时间并结合反应器出水效果给出相应的解决对策。反应器运行参数,见表2。
表 2 运行参数指标 常负荷 负荷1 负荷2 负荷3 曝气/L·min−1 1.20 1.20 1.20 1.50 1.80 2.10 污泥负荷/g·(L·d)−1 0.17 0.34 0.51 0.68 1.4 检测方法
实验过程中MLSS采用重量法测定[10];COD采用重铬酸钾法测定;TN采用碱性过硫酸钾消解紫外分光光度法测定;NH4+-N采用纳氏试剂分光光度法测定;TP采用钼酸铵分光光度法测定;DO和温度用WTW(oxi3310)便携式DO仪检测测定;EPS采用甲醛-NaOH法提取[11];PN含量采用Folin-酚法测定[12];EPS中PS含量采用苯酚-硫酸法测定[13],PN和PS的含量以MLSS计,mg/g。
2. 结果与分析
2.1 有机负荷冲击对污染物去除效果的影响
2.1.1 不同负荷下污染物去除效果
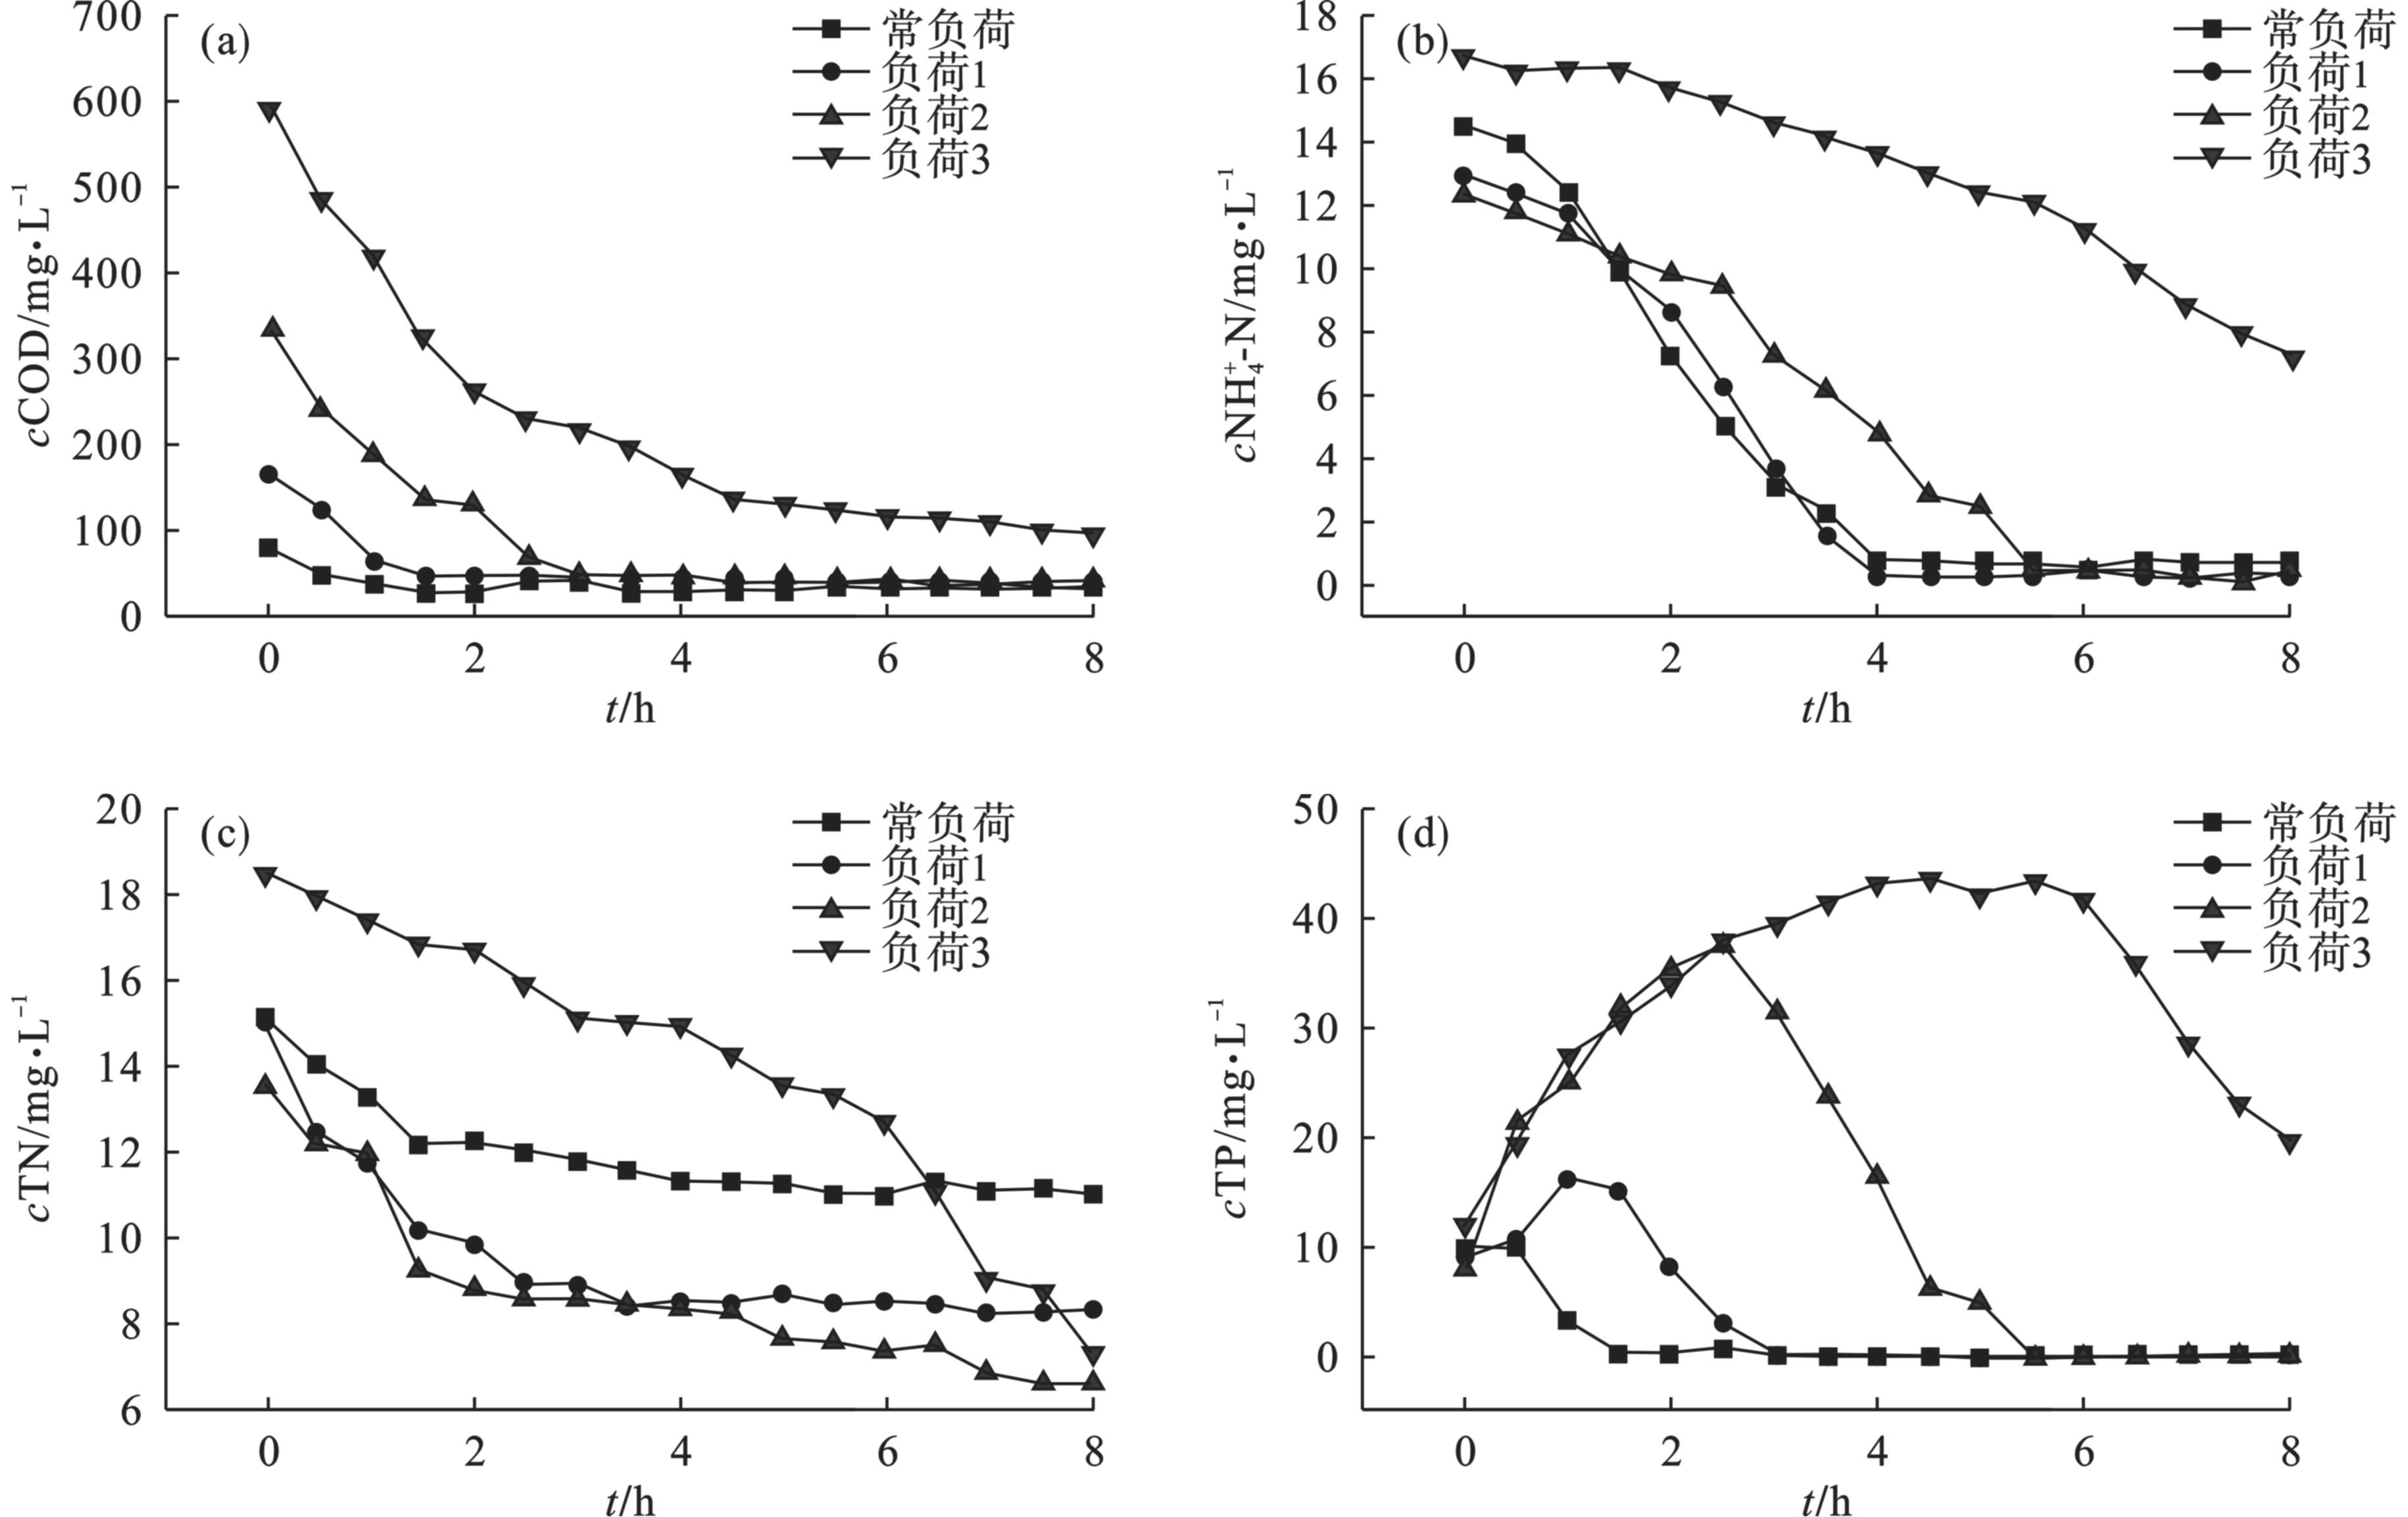
有机负荷对COD的降解。反应初期去除COD主要以物理吸附为主,活性污泥吸附量随着负荷的增加而增大。0~4 h期间常负荷、负荷1和负荷2基本完全降解,4~8 h期间COD处于平稳状态,出水COD分别为31.6、42.14和31.6 mg/L。0~8 h时负荷3在降解的过程中,随着降解时间的增加,COD的降解速度变慢,出水COD为96.32 mg/L。
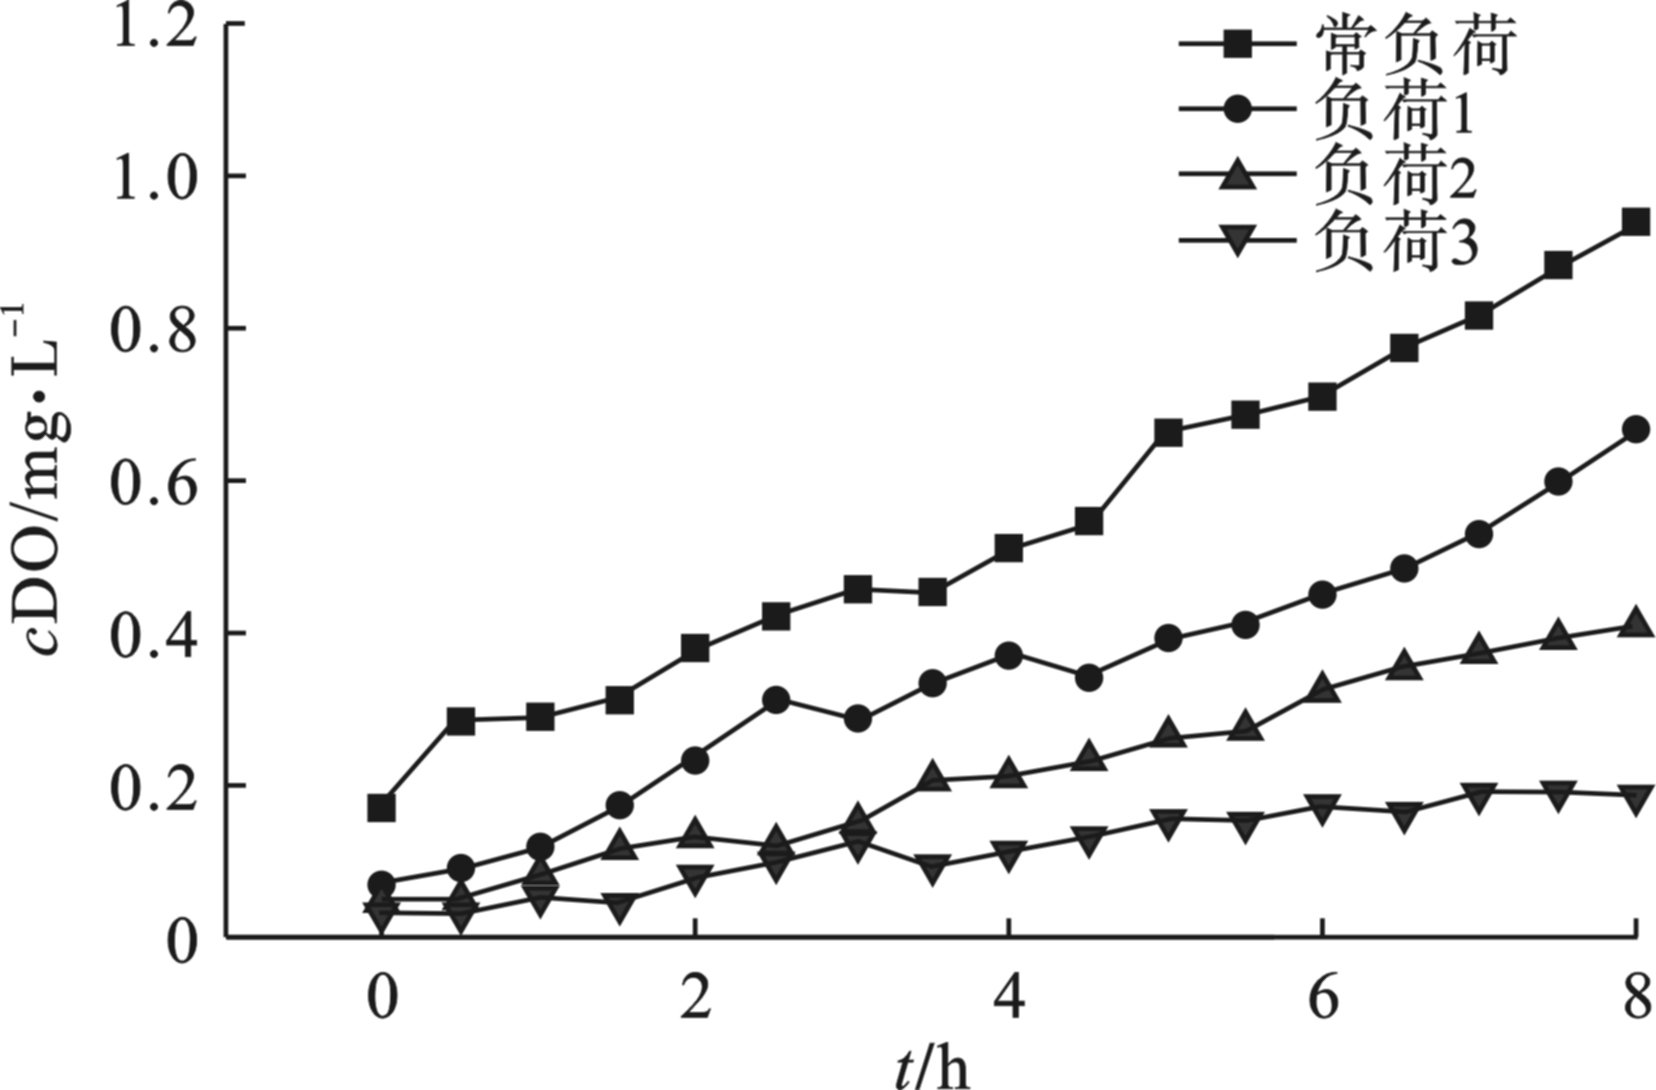
图2(b)可知,NH4+-N完全降解的时间随着负荷的增加而增加,负荷3的NH4+-N出水浓度为7.205 mg/L,末端溶解氧偏低,硝化反应无法充分进行。图3(c)可知,常负荷、负荷1和负荷2出水TN为11.045、8.302和6.59 mg/L ,结合图2(b)和图3可看出硝化反应充分进行,不同负荷冲击下为反硝化提供了充足的碳源,且随着有机负荷的增加而增加;DO偏低为反硝化提供了良好的缺氧环境,且充足的碳源有利于异养菌的增长,使得反硝化反应充分进行。图2(d)可知,TP降解历时中,PAOs的释放量随着负荷的增加而增加,负荷1、负荷2和负荷3情况下的TP检测最大值分别为16.096、37.4和43.6 mg/L,3种负荷条件下出水TP分别为0.056、0.104和19.3 mg/L。负荷3的TP出水超高的原因是进水负荷的增加,高浓度有机物能使聚磷菌(PAOs)更好的生成聚羟基烷酸,厌氧释磷不受影响可以很好的进行[14]。PAOs在厌氧条件下得到充分的碳源,释磷时间也随之增加;导致好氧吸磷的时间较短,出水TP浓度过高,其次高负荷冲击下(图3),冲击过程中DO一直处在偏低状态,异养菌和硝化细菌争夺DO,硝化反应发生不完全。由于进水有机物浓度高、曝气时间短不利于硝化细菌的生长,而残留在反应器内的硝化反应产物硝态氮抑制PAOs厌氧释磷[15]。另外,PAOs也需在好氧条件下吸收磷来合成ATP,无法为好氧吸磷和硝化反应提供足够的溶解氧。试验结果表明,系统在OLR达到0.68 g/(L·d)时反应器出水不满足《城镇污水处理厂污染物排放标准:GB 18918—2002》的一级A标准。通过上述研究发现DO对冲击过程影响较大,因此决定加大曝气量增加DO来改善氧环境,探索增加DO对活性污泥系统抗OLR冲击缓解作用大小。
2.1.2 自然恢复下污染物去除效果
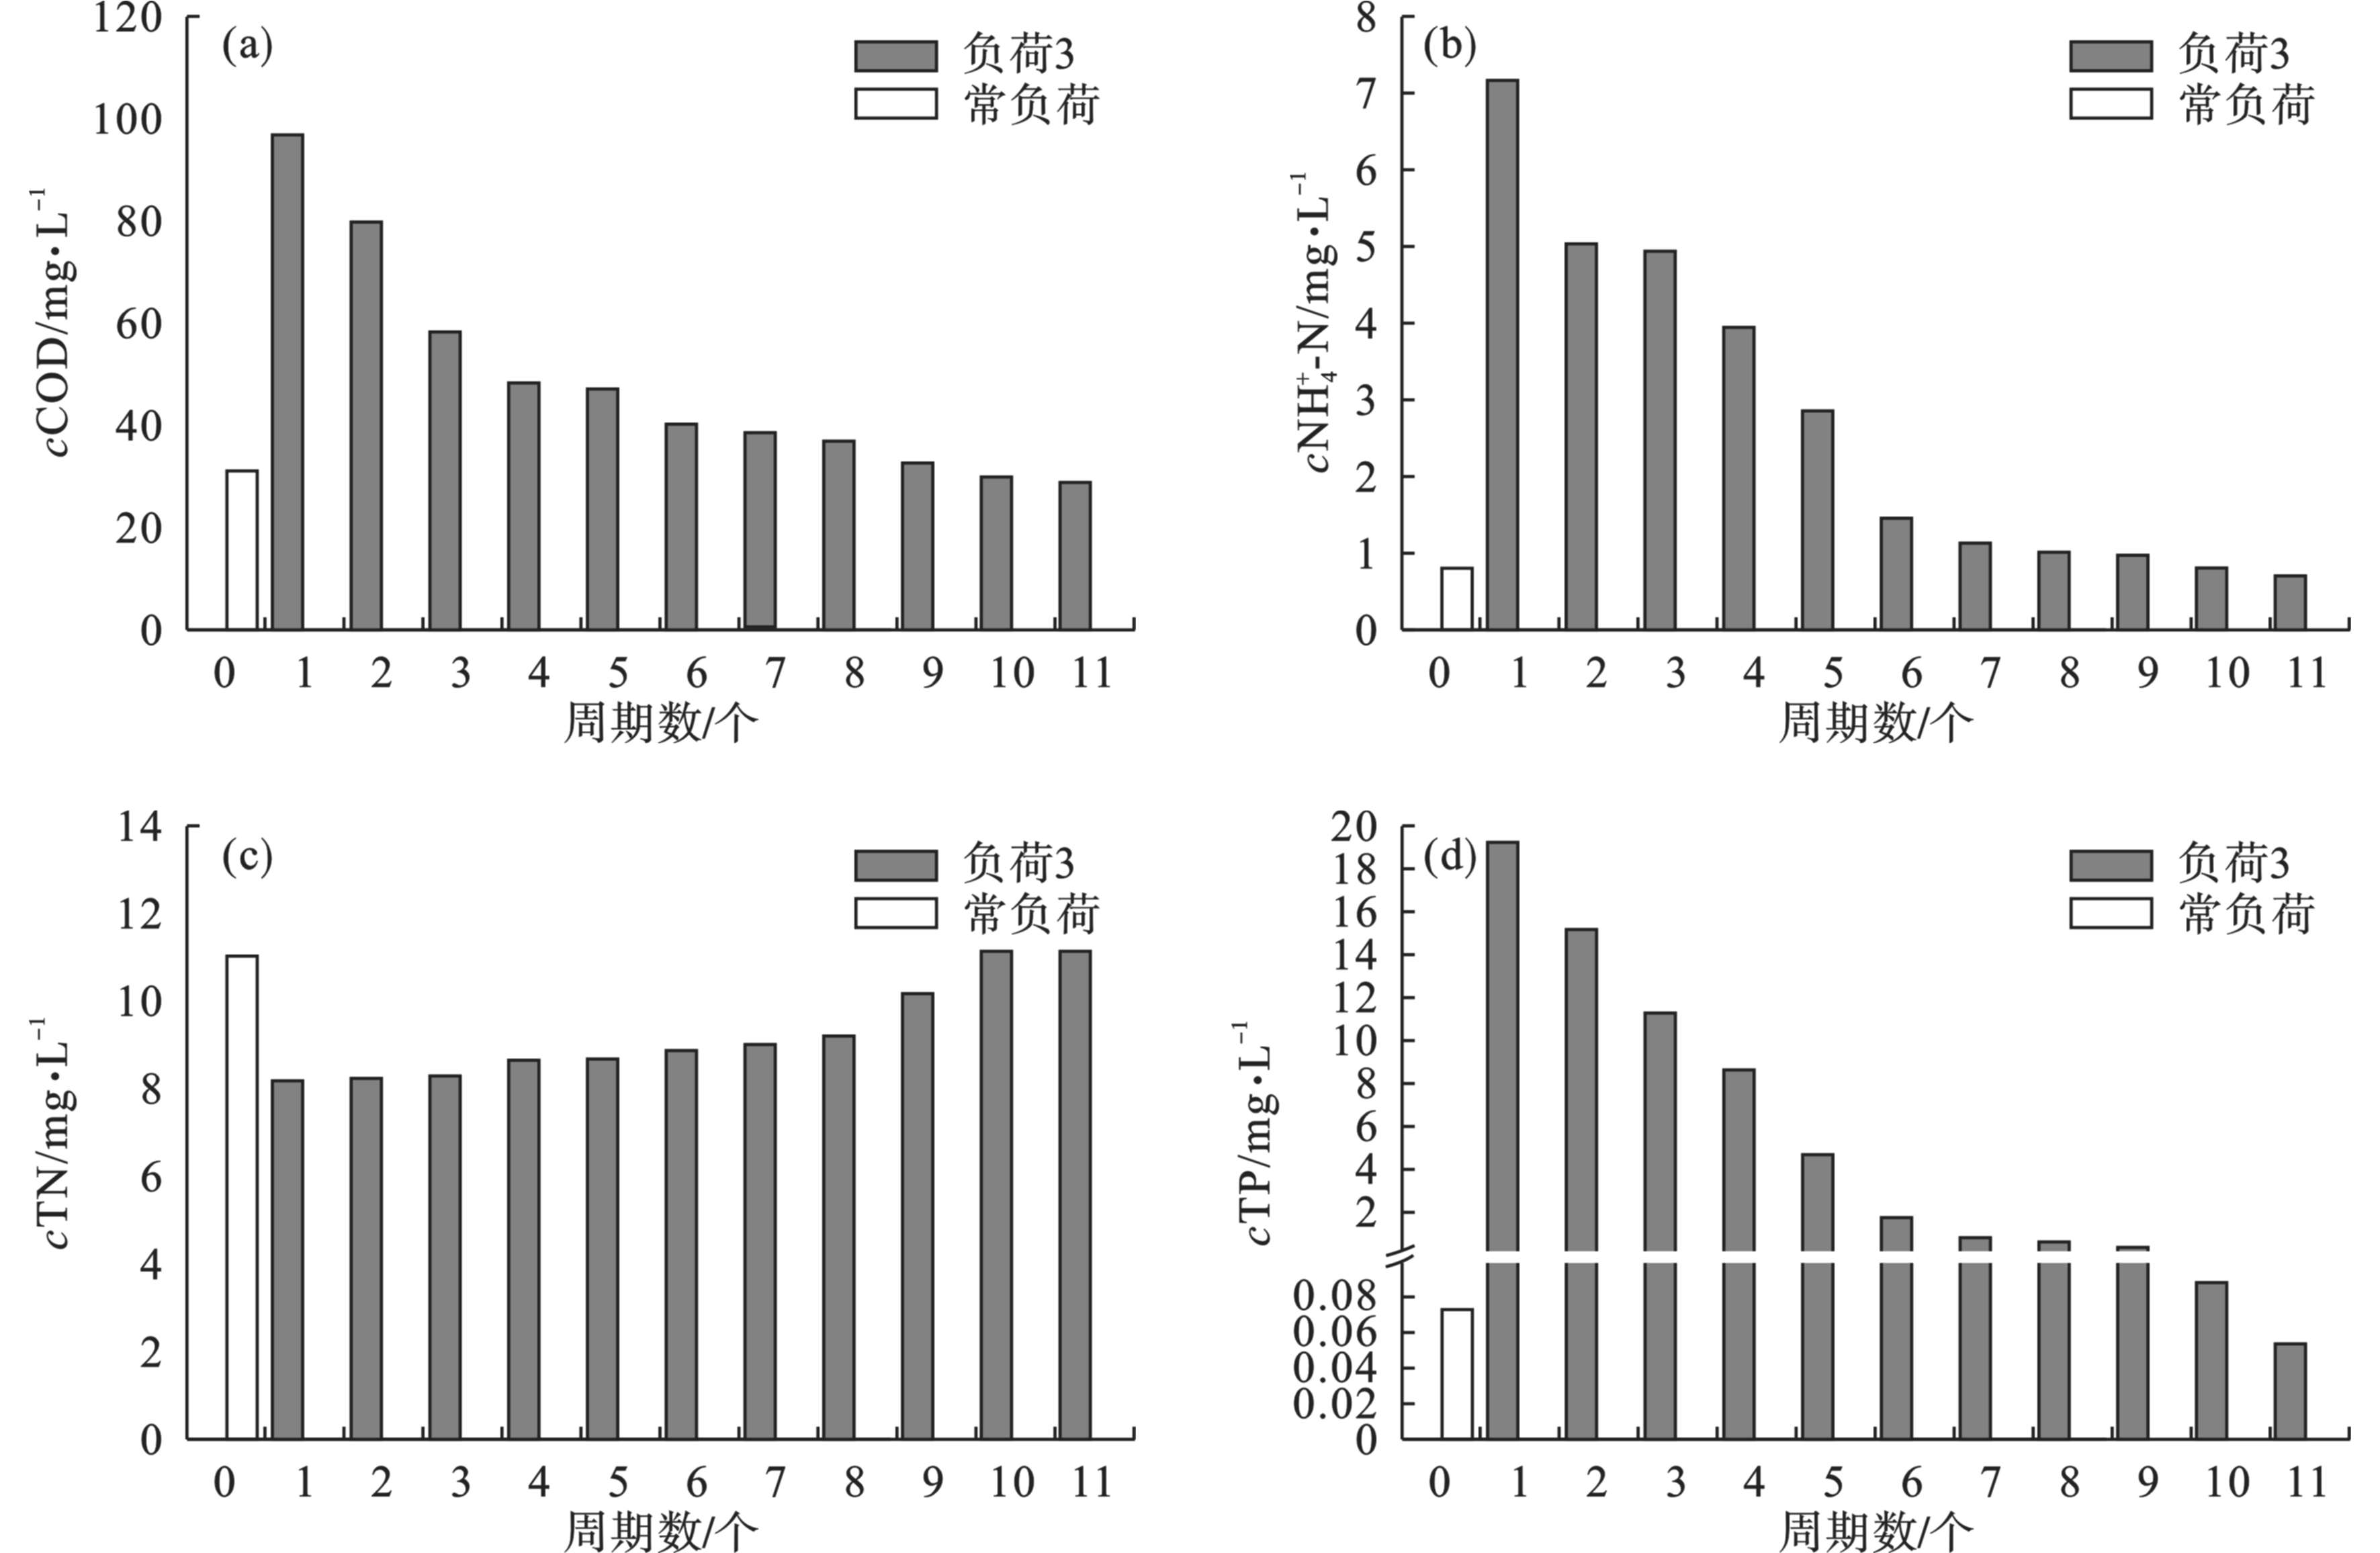
图4(a)可知,反应器经过4个周期COD出水达到48.19 mg/L,又经过7个周期自然恢复,恢复速率呈下降的趋势。第10个周期到第11个周期恢复速率逐渐平缓,且第11个周期时反应器出水28.67 mg/L,满足GB 18918—2002排放标准。
图4(b)可知,反应器经过3个周期NH4+-N出水4.964 mg/L,又经过3个周期自然恢复,恢复速率呈上升的趋势,在第11个周期时反应器NH4+-N出水达到0.682 mg/L。图4(b)和图4(c)可知,随着自然恢复期数的增长TN浓度也随之增长,NH4+-N浓度随之下降。原因是高有机负荷冲击下反应器溶解氧过低,硝化反应无法充分进行,高浓度有机物冲击下有利于异养菌的生长,且在低溶解氧条件下更有利于反硝化的进行。系统自然恢复的过程中随着周期数的增加,微生物得到充分的溶解氧,硝化反应进行充分,反硝化受到抑制造成硝态氮和亚硝态氮堆积,所以TN浓度也随之增高。图4(d)可知,反应器经过9个周期TP出水达到0.346 mg/L,又经过3个周期自然恢复出水达到0.054 mg/L,且自然恢复速率逐渐下降。原因是高有机负荷冲下,反应器在高浓度有机物条件下好氧异养菌与硝化菌以及PAOs争夺DO,抑制了PAOs好氧吸磷过程,恢复常负荷后PAOs得到充足的溶解氧且维持生命活动所消耗的有机物的量充足,通过自然恢复11个周期反应器出水TP满足城镇污水处理厂污染物排放标准。
2.2 有机负荷冲击对EPS的影响
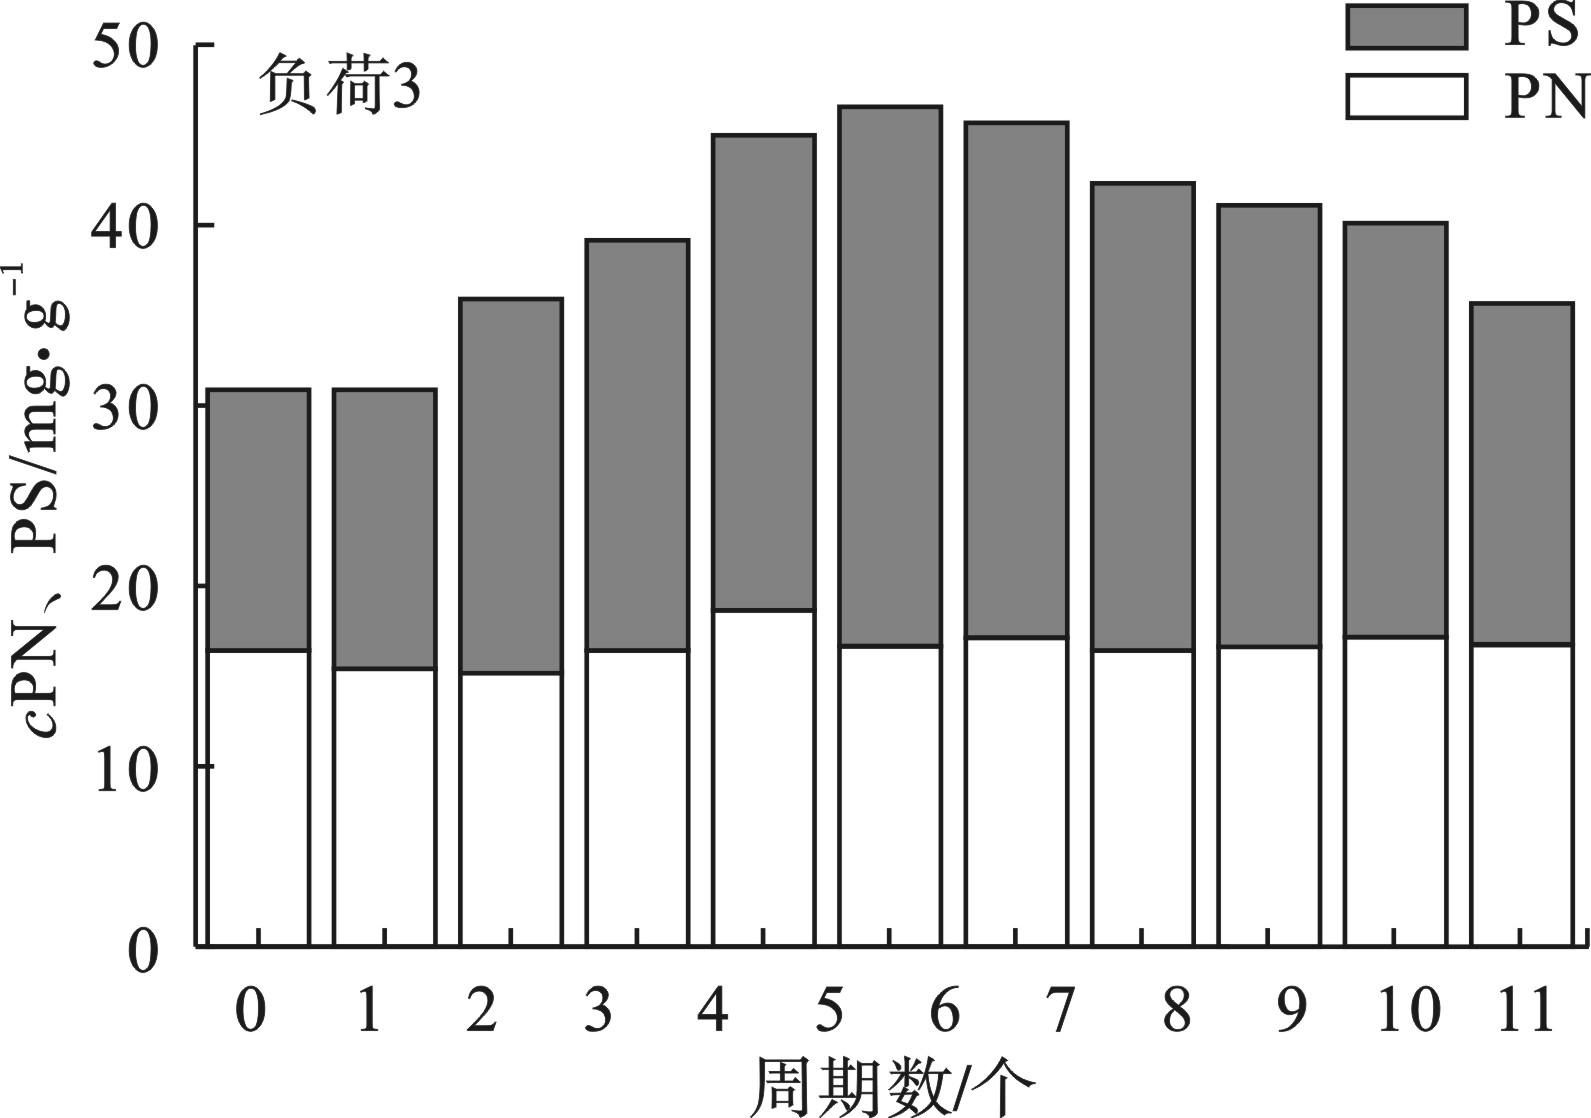
EPS是活性污泥在一定条件下分泌的、包裹在胞外的高分子聚合物,主要成分为PS、PN等[16-18]。活性污泥在受到水质、水量的冲击条件下,EPS能对微生物起着保护作用。由于反应系统在负荷3的条件下系统出水不达标,因此通过检测冲击前后EPS含量来得出活性污泥系统自然恢复周期。负荷3冲击前PS和PN分别为16.62和14.62 mg/g,经过5个周期后PS达到最大值为30.17 mg/g,PN无较大变化,为16.48 mg/g,又经过5个周期后PS降至19.16 mg/g,EPS恢复至冲击前要需11个周期。负荷3时EPS恢复至起始时的含量,在恢复过程中,PS含量变化较大,PN含量变化较小,有机负荷较高的情况下,微生物无法利用全部碳源来维持新陈代谢,而是将过量的碳源转化为PS。系统自然恢复的过程中,高有机负荷冲击下促进系统产生大量的异养型微生物,PS又作为碳源被系统微生物利用而逐渐减少,见图5。
2.3 曝气量对有机负荷冲击的调控作用
根据以上分析得出反应器在负荷3时脱氮除磷效率下降,主要原因在于高有机负荷冲击下反应器DO的不足,异养菌与硝化菌以及聚磷菌争夺DO,抑制了硝化作用和好氧吸磷过程。因此通过提高曝气量来解决高有机负荷冲击下反应器DO偏低的问题,并给出应对该问题的解决参数。
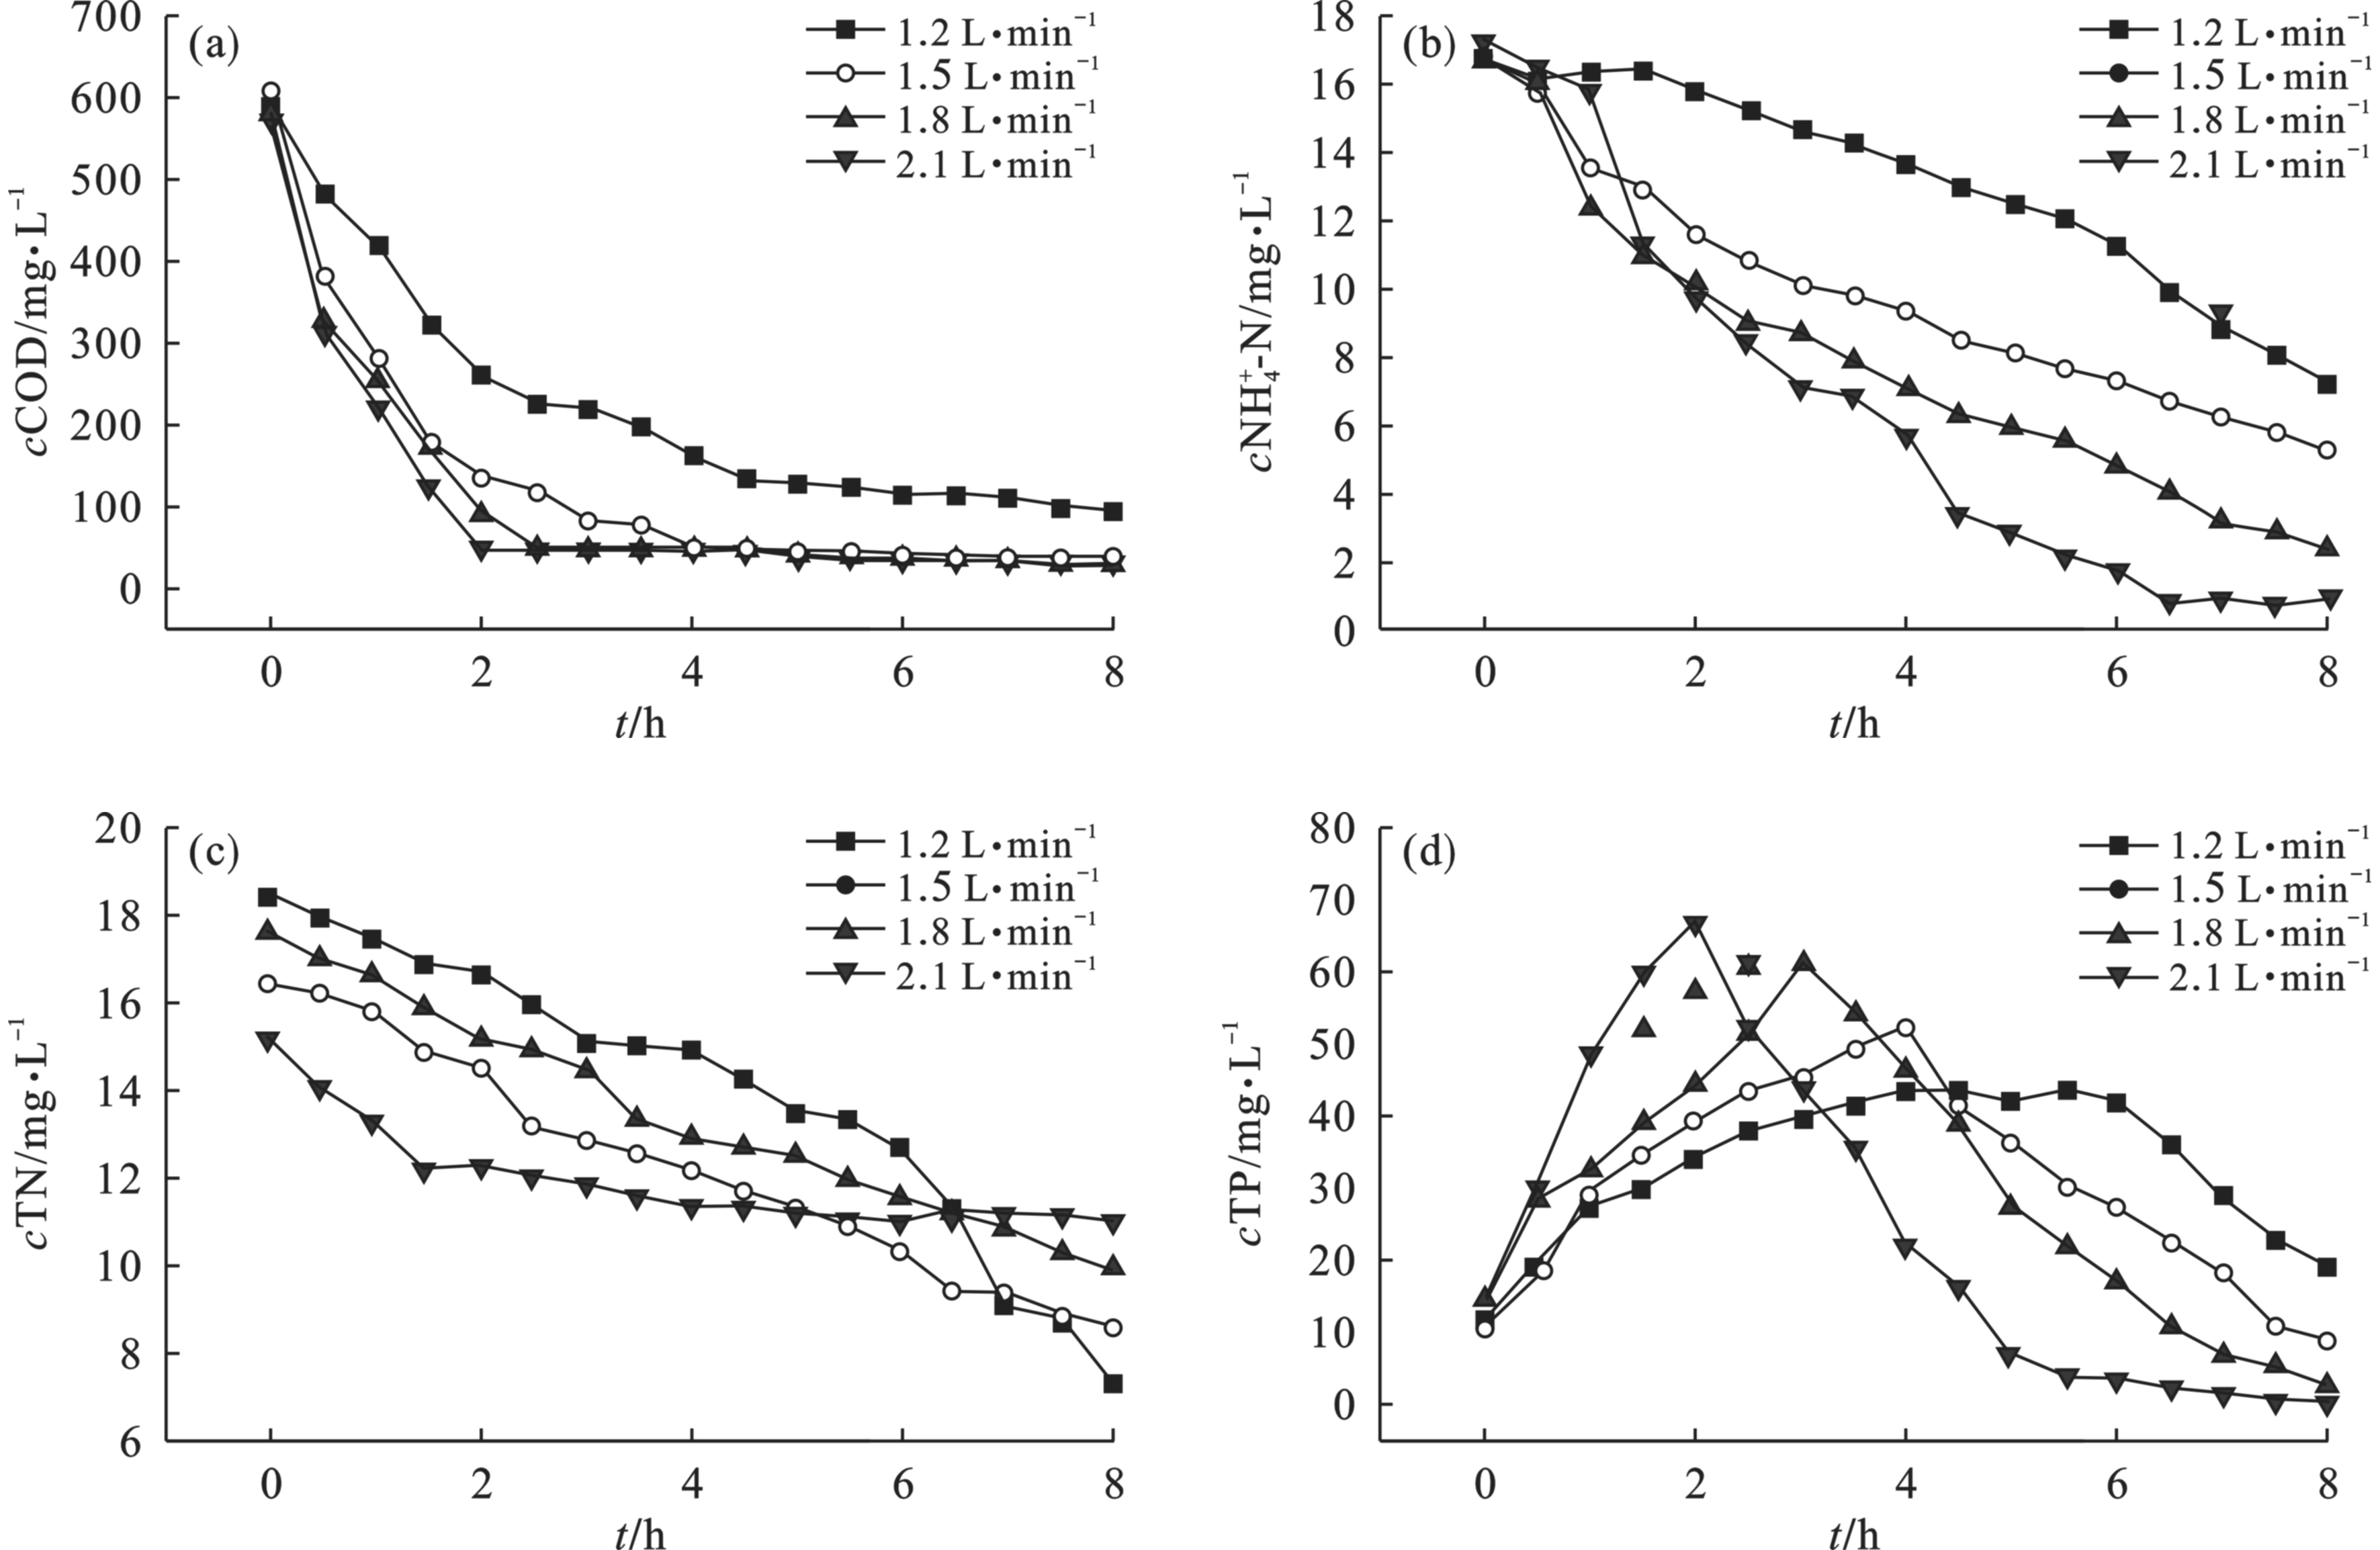
图6(a)可知,COD降解速率随着曝气量的增大而变快,曝气量分别为1.5、1.8和2.1 L/min,平均出水COD分别为39.66、28.25和31.59 mg/L。当气量增至2.1 L/min时,COD的降解速率相比于1.8 L/min时无变化。图6(b)可知,NH4+-N降解速率随着曝气量增加而增加,反应器得到充足的DO,硝化反应进行充分。在相同曝气时间时,出水NH4+-N浓度降低,曝气量分别为1.5、1.8和2.1 L/min时,平均出水NH4+-N分别为5.28、2.39和0.97 mg/L。图6(c)可知,气量越大TN降解速率越慢,原因是随着曝气量的增加反应器DO充足,厌氧时间缩短,不利于反硝化的充分进行。曝气量分别为1.5、1.8和2.1 L/min时平均出水TN分别为8.59、9.89和11.5 mg/L。图6(d)可知,随着曝气量的增加,PAOs得到充分的DO;厌氧释磷时间随曝气量增加而缩短。从图6中可以明显看到,不同的气量条件下磷的释放量也不同,气量越大磷的释放量相对越大,说明水中溶解氧越高,水力剪切力越大;把淀粉大分子物质分解成小分子糖类被PAOs储存,LIU et al [19]研究表明水力剪切力越大可促进PS分泌;因此PS也为厌氧释磷提供充足的碳源。当气量增至1.8 L/min时,反应器DO不足,硝化细菌和PAOs竞争反应器的溶解氧,此时DO不充足导致好氧吸磷无法充分进行。曝气量分别为1.5、1.8和2.1 L/min时平均出水TP分别为8.73、2.64和0.447 mg/L,提高曝气可使出水TP浓度降低。曝气量为2.1 L/min,污染物去除效率最高并且反应器出水达到城镇污水处理厂污染物排放标准。综合分析,负荷3下最适曝气量应为2.1 L/min。
3. 结论
(1)SBR活性污泥系统受单周期瞬时高浓度有机负荷冲击时,在0.68 g/(L·d)负荷条件下,反应8 h时的出水COD、NH4+-N、TN和TP分别为96.32、7.205、7.34和19.3 mg/L,不满足城镇污水处理厂污染物排放标准。DO不充足影响有机物的降解、硝化反应和好氧吸磷,且充足的碳源有利于反硝化和厌氧释磷进行。
(2)在0.68 g/(L·d)负荷条件下,系统冲击前PS和 PN分别为16.62和14.62 mg/L,冲击后EPS组分中PN含量无明显变化,PS含量经过11个周期自然恢复后;在第5个周期PS达到最大值。经过11个周期自然恢复后反应器出水COD、NH4+-N、TN和TP分别为28.67、0.682、11.12和0.054 mg/L满足GB 18918—2002排放标准,系统自然恢复至冲击前需要11个周期。
(3)瞬时有机负荷冲击导致反应器内DO不足,污染物去除效率降低的情况可采用提高曝气量的方式进行调控。在0.68 g/(L·d)负荷条件下,随着气量增加污染物去除效率提高,TN去除效率逐渐降低。通过调整曝气量的方式,在曝气量为2.1 L/min时,系统在0.68 g/(L·d)负荷条件下出水污染物满足污水处理厂污染物排放标准。
-
表 1 各水质指标的主成分载荷矩阵
Table 1. Principal component matrix of water quality indicators
指标 丰水期 枯水期 平水期 F1 F2 F3 F1 F2 F1 F2 溶解氧 0.016 0.879 0.442 −0.615 0.748 −0.508 0.648 高锰酸盐指数 0.874 0.138 −0.344 0.888 0.231 0.953 0.165 化学需氧量 0.944 0.182 −0.136 0.841 0.197 0.884 0.297 生化需氧量 0.859 0.301 −0.043 0.889 0.262 0.757 0.528 氨氮 0.816 −0.404 0.083 0.904 −0.121 0.804 −0.349 总磷 0.583 −0.403 0.670 0.885 −0.039 0.892 −0.234 表 2 各类型污染源污染负荷及占比
Table 2. Pollution load and proportion of each type of pollution source
污染源类型 COD NH3-N TP 入河量/t 占比/% 入河量/t 占比/% 入河量/t 占比/% 工业 751.63 8.61 20.91 3.81 2.36 1.59 城镇生活 2 444.70 28.02 233.94 42.67 22.82 15.39 农村生活 325.46 3.73 33.77 6.16 2.77 1.87 畜禽养殖 3 349.01 38.38 107.50 19.61 44.47 29.98 水产养殖 1 657.35 18.99 101.92 18.59 62.5 42.14 种植业 197.52 2.26 50.19 9.15 13.39 9.03 合计 8 725.67 100.00 548.23 100.00 148.31 100.00 -
[1] 龙颖贤, 张玉环, 卢加伟, 等. 珠三角地区水环境质量变化趋势及成因[J]. 环境影响评价, 2018, 40(5): 30 − 33. [2] 宋焱, 徐颂军, 刘贤赵, 等. 南沙红树林湿地公园水环境质量时空差异分析——基于改进后倍斜率聚类分析的视角[J]. 地理科学, 2016, 36(02): 303 − 311. [3] 朱琳, 王雅南, 韩美, 等. 武水河水质时空分布特征及污染成因的解析[J]. 环境科学学报, 2018, 38(6): 2150 − 2156. [4] 张彦, 邹磊, 梁志杰, 等. 暴雨前后河南北部河流水质分异特征及其污染源解析[J]. 环境科学, 2022, 43(5): 2537 − 2547. [5] 杨道军, 钱新, 殷福才, 等. 因子分析与聚类法的复合模型在水环境评价和管理中的应用[J]. 环境科学与管理, 2007, 32(4): 155 − 158. [6] NIRAULA R, KALIN L, SRIVASTAVA P, et al. Identifying critical source areas of nonpoint source pollution with SWAT and GWLF[J]. Ecological Modelling, 2013, 268: 123 − 133. doi: 10.1016/j.ecolmodel.2013.08.007 [7] MOCKLER E M, DEAKIN J, ARCHBOLD M, et al. Sources of nitrogen and phosphorus emissions to Irish rivers and coastal waters: Estimates from a nutrient load apportionment framework[J]. Science of the Total Environment, 2017, 601/602: 326 − 339. doi: 10.1016/j.scitotenv.2017.05.186 [8] ZHAO Z, TAO F, DU J, et al. Surface water quality and its control in a river with intensive human impacts-a case study of the Xiangjiang River, China.[J]. Journal of Environmental Management, 2010, 91(12): 2483 − 2490. doi: 10.1016/j.jenvman.2010.07.002 [9] 肖宇婷, 谌书, 樊敏. 沱江流域污染负荷时空变化特征研究[J]. 环境科学学报, 2021, 41(5): 1981 − 1995. [10] 徐责茗, 崔桢, 高俊峰, 等. 太湖流域养殖池塘的氮磷污染负荷估算[J]. 长江流域资源与环境, 2022, 31(1): 148 − 155. [11] 贺斌, 胡茂川. 广东省各区县农业面源污染负荷估算及特征分析[J]. 生态环境学报, 2022, 31(4): 771 − 776. [12] YUAN Y, KOROPECKYJ-COX L. SWAT model application for evaluating agricultural conservation practice effectiveness in reducing phosphorous loss from the Western Lake Erie Basin.[J]. Journal of environmental management, 2022, 302: 114000. doi: 10.1016/j.jenvman.2021.114000 [13] PLUNGE S, GUDAS M, Povilaitis A. Effectiveness of best management practices for non-point source agricultural water pollution control with changing climate - Lithuania's case[J]. Agricultural Water Management, 2022, 267: 107628. doi: 10.1016/j.agwat.2022.107628 [14] MA X, LI Y, ZHANG M, et al. Assessment and analysis of non-point source nitrogen and phosphorus loads in the Three Gorges Reservoir Area of Hubei Province, China[J]. Science of the Total Environment, 2011, 412: 154 − 161. [15] 胡芸芸, 王永东, 李廷轩, 等. 沱江流域农业面源污染排放特征解析[J]. 中国农业科学, 2015, 48(18): 3654 − 3665. [16] 生态环境部. 地表水环境质量评价办法(试行) [R]. 北京: 生态环境部, 2011. [17] 邵志江, 刘莲, 汪涛. 永定河上游张家口地区主要河流污染物来源解析[J]. 环境污染与防治, 2020, 42(2): 204 − 211. [18] 周广峰, 刘欣. 主成分分析法在水环境质量评价中的应用进展[J]. 环境科学导刊, 2011, 30(1): 75 − 78. [19] 生态环境部华南环境科学研究所. 第二次全国污染源普查生活污染源产排污系数手册(试用版) [R]. 广东: 生态环境部华南环境科学研究所, 2019. [20] 生态环境部第二次全国污染源普查工作办公室. 第二次全国污染源普查产排污系数手册(农业源) [M]. 北京: 中国环境出版集团, 2020.3-68. [21] 中国环境规划院. 全国水环境容量核定技术指南[R]. 北京: 中国环境规划院, 2003. [22] 于超, 储金宇, 白晓华, 等. 洱海入湖河流弥苴河下游氮磷季节性变化特征及主要影响因素[J]. 生态学报, 2011, 31(23): 7104 − 7111. [23] 代丹, 于涛, 雷坤, 等. 北京市清河水体非点源污染特征[J]. 环境科学研究, 2018, 31(6): 1068 − 1077. [24] CHEN D J, LU J, YUAN S F, et al. Spatial and temporal variations of water quality in Cao-E River of eastern China[J]. Journal of Environmental Sciences, 2006, 18(4): 680 − 688. [25] YU H B, XI B D, JIANG J Y, et al. Environmental heterogeneity analysis, assessment of trophic state and source identification in Chaohu Lake, China.[J]. Environmental science and pollution research international, 2011, 18(8): 1333 − 1344. doi: 10.1007/s11356-011-0490-8 [26] 杨丽萍. 浙江省两个典型流域水体污染特征及污染源解析研[D]. 杭州: 浙江大学, 2015. [27] 庄华萍. 吉林省畜禽粪污转化生物有机肥经济分析与政策建议[D]. 吉林: 吉林农业大学, 2022. [28] ZHANG Q, ACHAL V, XU Y, et al. Aquaculture wastewater quality improvement by water spinach ( Ipomoea aquatica Forsskal ) floating bed and ecological benefit assessment in ecological agriculture district[J]. Aquacultural Engineering, 2014, 60(3): 48 − 55. [29] 王钰钦, 郑尧, 钱信宇, 等. 中国水产养殖尾水污染现状及净化技术研究进展[J]. 农学学报, 2022, 12(3): 65 − 70. 期刊类型引用(5)
1. 胡昊杨,吴哲,侯成亮. 基于收尘管路设计优化和清灰系统的研究. 建筑机械. 2024(07): 13-15 .  百度学术
百度学术
2. 李建龙,陈源正,林子捷,吴泉泉,吴代赦. 除尘滤筒脉喷清灰技术研究进展与展望. 金属矿山. 2022(11): 23-35 .  百度学术
百度学术
3. 郗元,姜文文,代岩,王国际,闫志刚,任福良,牛凤娟. 基于CFD的锥形散射器强化清灰特性数值模拟及优化. 轻工机械. 2021(01): 98-103 .  百度学术
百度学术
4. 邱俊,陈强,李建龙,吴代赦. 数值模拟滤筒中负载尘饼对脉冲喷吹清灰效果的影响. 环境工程学报. 2021(03): 1067-1074 .  本站查看
本站查看
5. 莫布林. 基于设备组合控制方式的袋式除尘器脉冲喷吹控制系统. 东北电力技术. 2021(05): 28-31 .  百度学术
百度学术
其他类型引用(14)
-


 下载:
下载:
