


 百度学术
百度学术


全文HTML
人类的核能利用活动可能导致放射性废物释放到环境中,带来巨大的安全隐患,其中最受关注的裂变产物之一是放射性碘[1]。在碘的26种同位素中,125I、129I和131I会对环境产生较大的危害[2]。日本福岛核电站事故中,泄漏的放射性核素中含有大量129I和131I,并以气态和液态形式通过大气环流对多个国家和地区产生隐患。其中129I由于较长的半衰期对环境产生了更大的危害[3];而131I是核事故早期环境中放射性碘的主要成分,也严重污染生态环境[4-5]。因此,研究高效的除碘方法具有重要的现实意义。
目前,国内外去除放射性I-的方法有化学沉淀、离子交换、膜分离和吸附法等[6]。LIU等[7]采用化学沉淀法,通过投加CuCl生成难溶化合物CuI来去除模拟废水中的I-,对I-的去除率达到95.8%。杨云等[8]在此基础上,结合化学沉淀和膜分离工艺,使I-去除率达到95.0%。但是由于该工艺较复杂,工艺条件需保持低氧环境,投加药剂量大,在出水中引入较多盐类。离子交换法选择性强,但是交换容量小,受共存离子的影响较大。吸附法作为传统的处理方法,将一种或多种元素吸附在吸附剂表面或孔道,具有工艺简单、清洁、无污染等优点[9]。ZHANG等[10]利用椰壳活性炭制备的改性活性炭,通过表面负载的纳米Cu2O/Cu和活性炭的协同作用,对蒸馏水中的I-表现出较高的吸附特性,I-的去除率可以达到95.7%。但在自然水体中,共存离子可能对吸附效果产生负面影响。
传统单级吸附工艺中吸附效率较低,多级逆流吸附工艺可更大限度地利用吸附剂的吸附容量,溶液中吸附质的浓度可以降到更低。水相流动方向与吸附剂相流动方向相反的吸附称为逆流吸附。该工艺采用序批式操作,即原水首先与旧吸附剂接触,充分利用其吸附能力;再投加吸附剂进一步降低水中污染物浓度。吸附完成后,所投加吸附剂成为旧吸附剂,可为下一次序批操作利用。ZHAO等[11]采用粉末活性炭-微滤累积二级逆流吸附去除反渗透浓水中的有机物,在得到较高有机物去除率的同时,比单级吸附工艺节省42.8%的粉末活性炭投量;HAN等[12]建立了二级逆流吸附-微滤工艺去除模拟放射废水中的铯,与常规吸附相比,在相同的吸附剂投加量下,去除率由99.7%提高至99.9%。以上研究中,由于吸附剂都具有基本不脱附的特点,不会影响吸附剂的累积吸附效果,可以将其阶段性排出反应器。
1 材料与方法
1.1 材料
实验原水模拟放射性碘污染的地表水,采用天津市津南区的自来水配置,水质参数见表 1。采用非放射性KI固体溶于当地自来水作为原水,原水中的I-浓度为2.00 mg·L-1。
表1 实验原水水质
Table 1 Raw water quality in experiment
Table 1 Raw water quality in experiment
表1 实验原水水质
Table 1 Raw water quality in experiment
Table 1 Raw water quality in experiment
| K+/ (mg·L-1) |
Na+/ (mg·L-1) |
Ca2+/ (mg·L-1) |
Mg2+/ (mg·L-1) |
SO42-/ (mg·L-1) |
Cl-/ (mg·L-1) |
NO3-(以N计)/ (mg·L-1) |
Cu2+/ (mg·L-1) |
pH |
| 14.0 | 29.8 | 36.3 | 8.74 | 47.8 | 24.7 | 0.856 | 0.007 | 7.65 |
本实验采用的吸附剂来自ZHANG等[10]制备的具有高吸附性和稳定性的改性活性炭。将聚乙烯亚胺与Cu(NO3)2·3H2O溶解后与80~100目的椰壳活性炭于高压釜内220 ℃下加热3 h后,冷却后洗净、真空干燥后即得改性活性炭。
实验所用试剂均为分析纯,KI购于大连美仑生物技术有限公司,I-的浓度测定依据生活饮用水标准检验方法[15],使用TU-1810紫外分光光度计测定;pH由HACH-PHC101酸度计测定;水中阳离子由X7 Series电感耦合等离子体质谱仪测定;水中阴离子由DX-1100离子色谱仪测定;浊度由HACH-2100光电浊度仪测定,所用的恒温摇床型号为HT-2102C,电动搅拌器的型号为D-8401WZ。
烧杯实验所用微滤膜由上海密粒公司提供,其孔径为0.22 μm。
1.2 方法
1.2.1 吸附动力学、不同吸附剂投加量和吸附等温线实验
取数个250 mL锥形瓶,各加入实验原水和一定质量的吸附剂,置于恒温摇床内振荡,设定转速为200 r·min-1、温度为25 ℃。吸附一定时间后,用微滤膜进行固液分离,测定滤液中的I-浓度。其中吸附等温线实验原水I-浓度范围为0.40~30.0 mg·L-1。
1.2.2 脱附实验
与吸附实验类似,向250 mL锥形瓶中加入200 mL实验原水和一定量吸附剂,在恒温摇床内达到吸附平衡,然后取出180 mL上清液并测定其中I-的浓度;向剩余含I-溶液中加入180 mL空白自来水,在恒温摇床内脱附平衡后测定溶液中I-的浓度。用减差法计算解吸量后求得脱附率。
1.2.3 新型二级逆流吸附实验装置与运行
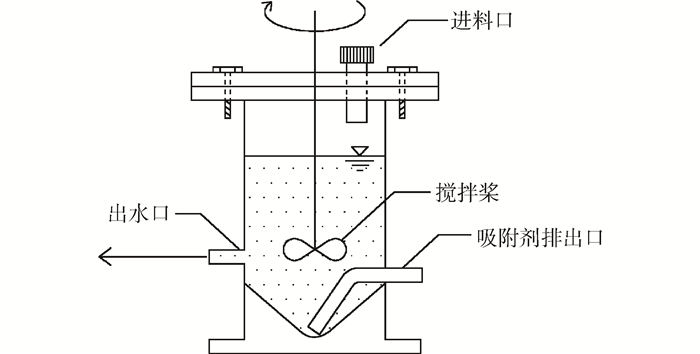
二级逆流吸附实验在图 1所示的反应器中进行。反应器的材料为有机玻璃,内径60 mm,有效容积为200 mL,底部锥形角为90°。搅拌桨通过搅拌器控制转速为200 r·min-1,反应器顶部设有进料口,左侧为出水口,通过重力排水。右侧为吸附剂排出口,其与蠕动泵连接,通过调整转速,将沉淀在锥形底部的吸附剂通过硅胶管随少量液体排出。
图1 新型二级逆流吸附装置图
Fig. 1 Set-up diagram of new countercurrent two-stage adsorption system
Fig. 1 Set-up diagram of new countercurrent two-stage adsorption system
定义每次出水排出后滞留溶液体积与反应器中溶液总体积之比为稀释因子F,本实验中F值采用0.200。
新型二级逆流吸附的工作过程如下:
1) 启动阶段。向装置中加入体积为V、浓度为C0的实验原水和投量为m/V的吸附剂,搅拌至吸附平衡后,静置沉淀5 min后用蠕动泵抽出吸附剂(排出吸附剂时带出的溶液体积小于总溶液体积的3%)。再投入m/V的吸附剂,吸附平衡后,静置沉淀5 min后在重力作用下排出体积为(1-F)V的上清液。
2) 运行阶段。运行阶段的每个周期原水经历二级吸附,吸附级数按吸附过程的先后定义。一级吸附过程中向装置中加入体积为(1-F)V的实验原水,与装置中剩余的溶液混合,混合液与装置内的旧吸附剂吸附平衡后静置沉淀5 min,并通过蠕动泵排出吸附剂;二级吸附过程中投加吸附剂,将m/V的吸附剂加入反应器中,吸附平衡后在重力作用下排出体积为(1-F)V的上清液,排出的上清液用微滤膜过滤后测定I-浓度。启动阶段运行之后,根据运行阶段循环出水I-浓度验证新型二级逆流吸附的计算方法。
2 结果与讨论
2.1 吸附动力学
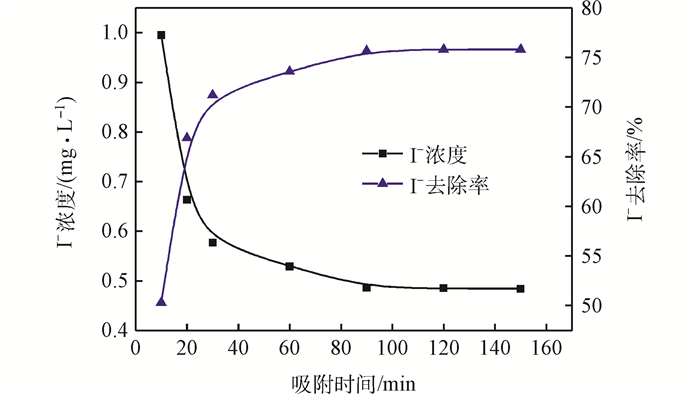
当吸附剂投加量为1.00 g·L-1时,动力学实验结果如图 2所示。在最初的30 min内, I-浓度迅速下降,在30~90 min之间I-浓度缓慢下降,90 min之后I-浓度基本不变,去除效率逐渐趋于恒定,故吸附平衡时间设定为90 min。此时I-的去除率达到76.0%左右。
图2 出水I-浓度和去除率随吸附时间的变化
Fig. 2 Change of I- concentration and removal efficiency in effluent with adsorption time
Fig. 2 Change of I- concentration and removal efficiency in effluent with adsorption time
图2 出水I-浓度和去除率随吸附时间的变化
Fig. 2 Change of I- concentration and removal efficiency in effluent with adsorption time
Fig. 2 Change of I- concentration and removal efficiency in effluent with adsorption time
2.2 吸附剂投加量对自来水中I-吸附效果的影响
本实验研究吸附剂投加量对去除I-的效果,优化投加量对于减少运行费用和固体废物的产生具有重要意义。吸附剂投量与I-去除率的关系如图 3所示。
图3 吸附剂投加量对自来水中I-去除效果的影响
Fig. 3 Effect of adsorbent dosage on I- removal in tap water
Fig. 3 Effect of adsorbent dosage on I- removal in tap water
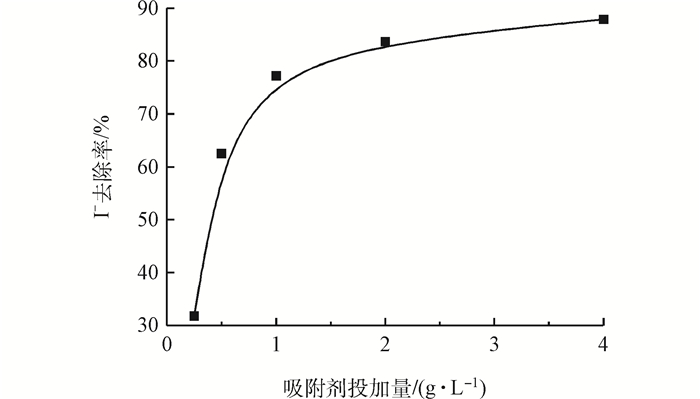
由图 3可知,当投加量为0.25~1.00 g·L-1时,I-去除率迅速上升;投加量为1.00~4.00 g·L-1时,去除率上升变缓,最后趋于平衡。增加投量可使接触面积增多,从而更有利于对I-的吸附,I-去除率逐渐增加[16]。然而吸附过程是一个动态平衡过程,当吸附到一定程度,溶液中I-与吸附剂表面的I-达到动态平衡,增加投量,去除率无显著提高而趋向平衡。根据图 3的结果,吸附剂的投量确定为1.00 g·L-1,此时I-去除率为76.0%。由于自来水体中共存离子的干扰,使得吸附剂的吸附效果较ZHANG等[10]在蒸馏水中获得的去除率明显降低,所以开发此新型二级逆流吸附工艺来提高去除率。另外,为与后续结果比较,研究投加量为1.25 g·L-1时I-的去除率,此值为78.0%。
2.3 吸附等温线
| qe=C0−CemV=abCe1+aCe | (1) |
图4 Langmuir吸附等温式拟合曲线
Fig. 4 Langmuir adsorption isotherm fitting curve
Fig. 4 Langmuir adsorption isotherm fitting curve
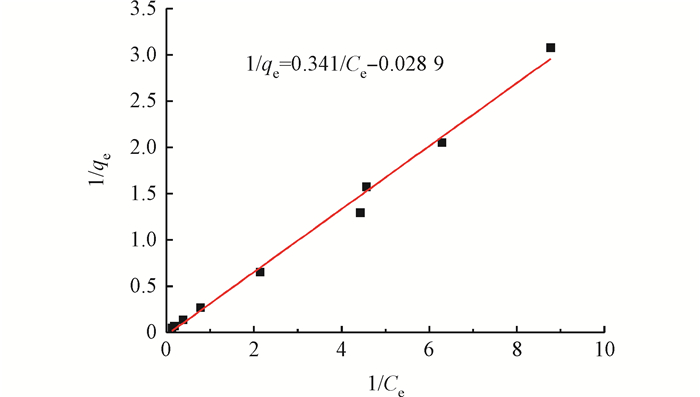
式中:qe为吸附剂相平衡浓度,mg·g-1;Ce为吸附平衡时的溶质浓度,mg·L-1;a,b为Langmuir等温线方式常数,单位分别为L·mg-1和mg·g-1;m为吸附剂的投加质量,g;V为溶液的体积,L。
经拟合计算,以1/qe对1/Ce作图可得到一条直线,该拟合直线的相关系数为0.993,由此可以推断吸附过程较好地遵循Langmuir吸附等温方程。式(2)为Langmuir吸附等温线的表达式。
| qe=2.94Ce1−0.084 9Ce | (2) |
2.4 脱附实验
按照1.2.2节中的方法进行实验,吸附剂投加量为1.00 g·L-1。如果吸附剂吸附的I-没有脱附,则加入空白自来水后,水中I-浓度的降低仅仅是稀释作用,实验结果如表 2所示。定义脱附率为脱附I-的质量与吸附I-的质量比。
表2 吸附和脱附平衡后液相及吸附剂相I-浓度
Table 2 Concentration of I- in liquid and adsorbent phase at adsorption and desorption equilibrium
Table 2 Concentration of I- in liquid and adsorbent phase at adsorption and desorption equilibrium
表2 吸附和脱附平衡后液相及吸附剂相I-浓度
Table 2 Concentration of I- in liquid and adsorbent phase at adsorption and desorption equilibrium
Table 2 Concentration of I- in liquid and adsorbent phase at adsorption and desorption equilibrium
| 项目 | 液相平衡浓度/ (mg·L-1) |
平衡后吸附剂相浓度/ (mg·g-1) |
| 吸附 | 0.471 | 1.53 |
| 脱附 | 0.267 | 1.31 |
一般而言,吸附作用是可逆的。吸附平衡时,吸附质的液相浓度Ce和吸附剂相浓度qe可由式(2)计算,当平衡的吸附剂与低于Ce的溶液接触时脱附可能发生[18]。由表 2可知,吸附和脱附后吸附剂相平衡浓度分别为1.53 mg·g-1和1.31 mg·g-1,所以计算得脱附率为14.3%,不可忽略。
由于吸附剂吸附I-后在水溶液中发生了较显著的脱附,其在反应器内的累积会对I-的吸附产生负面影响。因此,在新型二级逆流吸附工艺中,在投加新吸附剂之前将反应器内的吸附剂排出,以去除吸附剂脱附产生的干扰。
2.5 新型二级逆流吸附的理论计算
新型二级逆流吸附工艺的计算基于以下假设:当I-的液相浓度高于与吸附剂吸附平衡的液相浓度时,此吸附剂仍具有吸附能力。二级吸附的平衡吸附量可叠加,且仍遵循式(2)。新型二级逆流吸附工艺流程如图 5所示。反应器处理溶液的总体积为V (200 mL),吸附剂投量为m/V (1.00 g·L-1),原水I-浓度为C0 (2.00 mg·L-1),吸附后平衡浓度为Ce,吸附过程遵循吸附等温式(2)。
图5 新型二级逆流吸附工艺流程
Fig. 5 Schematic illustration of new countercurrent two-stage adsorption system
Fig. 5 Schematic illustration of new countercurrent two-stage adsorption system
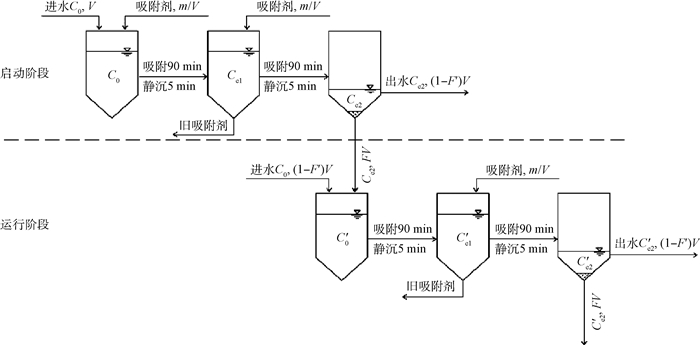
启动阶段,先向反应器投入m/V (1.00 g·L-1)的吸附剂,吸附平衡后,液相溶质浓度达到Ce1;排出反应器内的旧吸附剂后,再投入量为m/V (1.00 g·L-1)的吸附剂,吸附平衡后,液相溶质浓度达到Ce2。由式(2)可得式(3)和式(4),分别计算Ce1和Ce2。
| C0−Ce1mV=2.94Ce11−0.084 9Ce1 | (3) |
| Ce1−Ce2mV=2.94Ce21−0.084 9Ce2 | (4) |
当F=0.200时,反应器的混合溶液剩余体积为0.200V,启动阶段投加的吸附剂也存在其中。在运行阶段,向反应器中加入0.800V的实验原水,假设吸附过程是在均匀混合后发生,则吸附前反应器内混合溶液浓度为C′0=0.200C0+0.800Ce2。吸附平衡后浓度为C′e1,根据假设及式(4),按式(5)计算C′e1。
| Ce1−Ce2mV+C′0−C′e1mV=2.94C′e11−0.084 9C′e1 | (5) |
其后排出反应器内的旧吸附剂,投入m/V (1.00 g·L-1)的吸附剂,吸附平衡后第1个循环出水I-浓度为C′e2,其计算如式(6)所示。
| C′e1−C′e2mV=2.94C′e21−0.084 9C′e2 | (6) |
计算时公式中的吸附剂投加量m/V始终保持1.00 g·L-1,依次求解式(3)~式(6),可分别计算出Ce1、Ce2、C′e1和C′e2,结果见表 3。由表 3可知,工艺运行后理论出水浓度与启动阶段的浓度相同,C′e2为0.124 mg·L-1。
表3 各工艺段I-浓度计算值
Table 3 Calculated values of I- concentration in each stage
Table 3 Calculated values of I- concentration in each stage
表3 各工艺段I-浓度计算值
Table 3 Calculated values of I- concentration in each stage
Table 3 Calculated values of I- concentration in each stage
| mg·L-1 | |
| 参数 | 浓度 |
| Ce1 | 0.492 |
| Ce2 | 0.124 |
| C′0 | 1.62 |
| C′e1 | 0.490 |
| C′e2 | 0.124 |
在以后的各个周期中,由于二级逆流吸附的操作过程相同,所以每个周期出水I-浓度与第1周期的出水I-浓度C′e2相同,并维持恒定。由于实际实验运行中,每个周期末出水体积为(1-F)V,运行中每个周期吸附剂的投加量为m,因此运行阶段的实际吸附剂消耗量为m/(1-F)V。当F=0.200时,吸附剂用量为1.25 g·L-1。
2.6 计算方法的验证
按照1.2.3节所述方法,获得出水I-浓度实测值,结果如图 6所示。将实测值与计算值进行比较,以验证计算方法的合理性。由图 6可知,实验值与计算值较接近,具有较高的吻合度。因此,新型二级逆流吸附工艺的计算方法能较准确预测出水水质。
图6 出水循环的实测值与计算值的对比
Fig. 6 Comparison of experimental and calculated values in effluent cycles
Fig. 6 Comparison of experimental and calculated values in effluent cycles
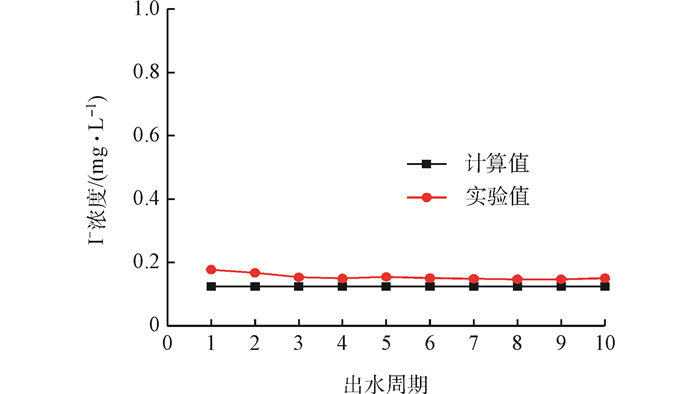
10个周期出水I-浓度实测平均值为0.150 mg·L-1,I-的去除率为92.5%;而计算值为0.124 mg·L-1,I-的计算去除率为93.8%,2个去除率差别不大。分析差别产生的原因:在搅拌过程中容器壁和搅拌桨会黏附少量吸附剂,致使实际参加吸附的吸附剂比实际投加的量要少,吸附效果受到影响。另外实验期间由于部分旧吸附剂黏附在反应器内壁,未被完全排出而发生脱附也是产生误差的原因。
与单级吸附相比较,新型二级逆流吸附工艺中吸附剂经过二级吸附,充分利用了其吸附容量。在相同的吸附剂投量下,I-去除率从78.0%提高至92.5%。
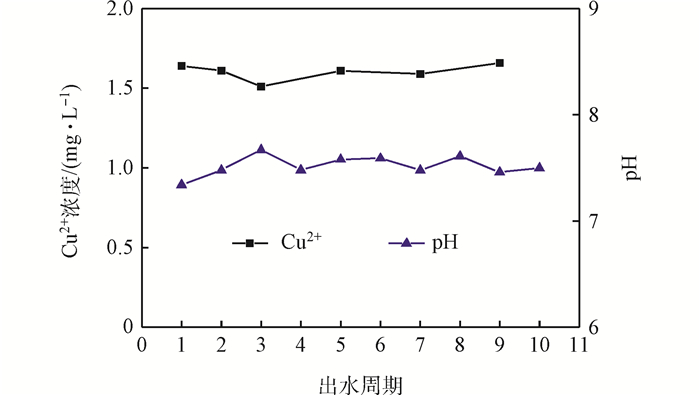
将10个循环的出水混合,测定混合出水的水质,结果如表 4所示。对比表 1和表 4可以看出,出水中NO3-(以N计)浓度较原水升高,可能是由于吸附剂制备过程中引入了Cu(NO3)2·3H2O,但仍符合中国生活饮用水卫生标准[19]。另外,对出水中Cu2+和pH进行测定,结果如图 7所示。出水中pH平均值为7.50,Cu2+平均浓度为1.60 mg·L-1,高于中国生活饮用水卫生标准[19],但是符合世界卫生组织颁布的《饮用水水质准则》[20],这方面有待进一步研究。
表4 新型二级逆流吸附循环出水水质
Table 4 Effluent quality from new countercurrent two-stage adsorption process
Table 4 Effluent quality from new countercurrent two-stage adsorption process
表4 新型二级逆流吸附循环出水水质
Table 4 Effluent quality from new countercurrent two-stage adsorption process
Table 4 Effluent quality from new countercurrent two-stage adsorption process
| K+/ (mg·L-1) |
Na+/ (mg·L-1) |
Ca2+/ (mg·L-1) |
Mg2+/ (mg·L-1) |
SO42-/ (mg·L-1) |
Cl-/ (mg·L-1) |
NO3-(以N计)/ (mg·L-1) |
Cu2+/ (mg·L-1) |
pH |
| 3.01 | 29.1 | 36.8 | 8.72 | 39.6 | 23.1 | 5.92 | 1.60 | 7.55 |
图7 循环出水中的Cu2+及pH的变化
Fig. 7 Change of Cu2+ and pH in effluent with cycles
Fig. 7 Change of Cu2+ and pH in effluent with cycles
3 结论
1) 在以自来水配制的含I-溶液中,吸附剂对I-的吸附过程符合Langmuir吸附等温式,吸附在90 min达到平衡。
2) 吸附剂在吸附I-后在水溶液中的脱附不可忽略,因此设计了新型二级逆流吸附工艺以消除脱附的影响,并推导出该工艺出水I-浓度的计算方法。
3) 在模拟的放射性含碘废水中,新型二级逆流吸附工艺结合能够更高效地去除水中的I-。实验条件下运行,出水水质稳定,I-去除率可以达到92.5%,实验值与计算值较接近,偏离程度较小。
4) 相比单级吸附,新型二级逆流吸附工艺中,吸附剂经过二次吸附,充分利用了其吸附容量。在相同的吸附剂投加量下I-去除率由78.0%提高至92.5%。与前期研究相比,该工艺较大幅度地提高I-去除率,降低了运行成本,对工程应用具有指导意义。
 下载:
下载:
